8 QUANT Based DI PYQ (Solutions)
Master QUANT Based DI for CAT 2026 with practice questions and detailed explanations
Quant-Based DI Sets
“Quant-Based DI” refers to data interpretation sets that are heavy on calculations (percentages, growth rates, arithmetic) rather than just observation. Some CAT DI sets require substantial number crunching.
- CAT 2018 Slot 2:
- “Profitability and Market Share” (moderate) – required calculating ratios
- “Currency Conversion” (difficult) – required multi-step calculations
- CAT 2017: 31% of DILR sets were calculation-heavy DI.
- CAT 2020–2021: Quant-based DI sets appeared, e.g., “Sales at a Store” in 2020 Slot 2 – difficult, calculation-intensive.
Key Insights:
- Some DI sets are reasoning-based with little math; the balance shifts year to year.
- CAT 2018 had 0% pure observation DI in Slot 2 because most sets required math.
- Typically, 1–3 DI sets per year demand significant calculations (percent changes, projections).
- Calculation-heavy sets are time-intensive, so careful time management is crucial during preparation.
Weightage Over Past Years
| Year | Q.NONumber of questions | Difficulty Level |
|---|---|---|
| 2022 | 1 | Hard |
| 2021 | 2 | Medium |
| 2019 | 4 | Hard |
| 2018 | 1 | Hard |
CAT 2022 QUANT Based DI questions
Question 1
Slot-2
The two plots below show data for four companies code-named A, B, C, and D over three years - 2019, 2020, and 2021.
The first plot shows the revenues and costs incurred by the companies during these years. For example, in 2021, company C earned Rs. 100 crores in revenue and spent Rs. 30 crores. The profit of a company is defined as its revenue minus its costs.
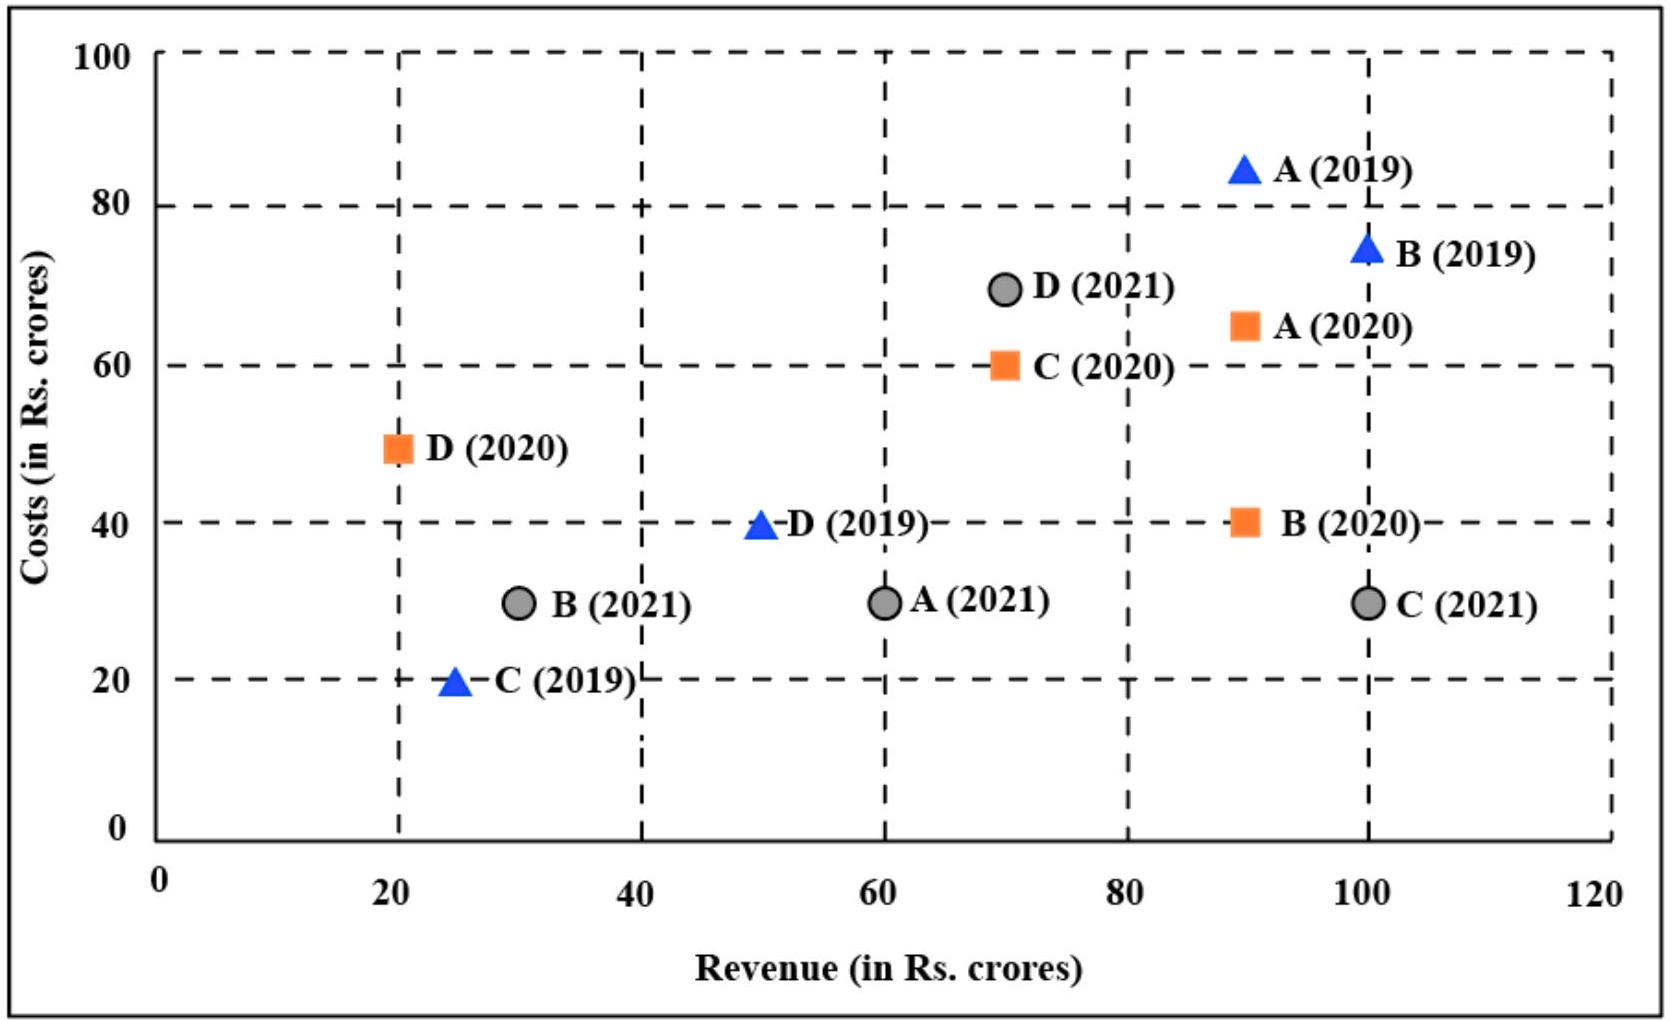
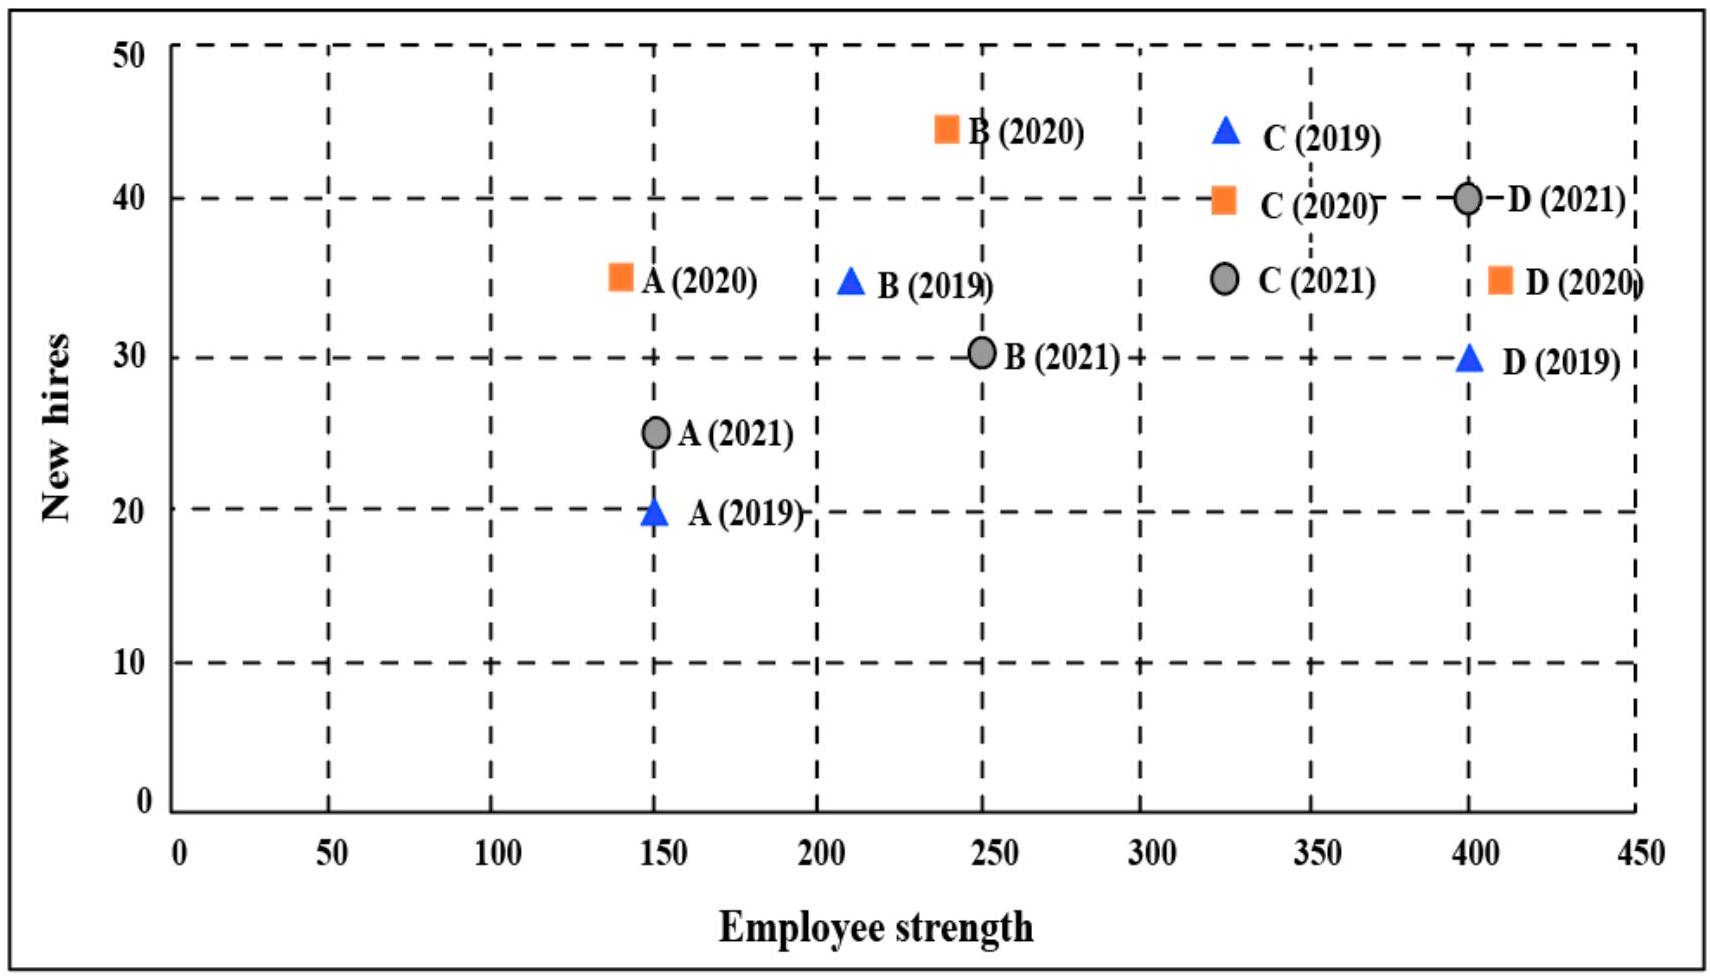
The second plot shows the number of employees employed by the company (employee strength) at the start of each of these three years, as well as the number of new employees hired each year (new hires). For example, Company B had 250 employees at the start of 2021, and 30 new employees joined the company during the year.
The two plots below show data for four companies code-named A, B, C, and D over three years - 2019, 2020, and 2021.
The first plot shows the revenues and costs incurred by the companies during these years. For example, in 2021, company C earned Rs. 100 crores in revenue and spent Rs. 30 crores. The profit of a company is defined as its revenue minus its costs.
The second plot shows the number of employees employed by the company (employee strength) at the start of each of these three years, as well as the number of new employees hired each year (new hires). For example, Company B had 250 employees at the start of 2021, and 30 new employees joined the company during the year.
Considering all three years, which company had the highest annual profit?
Considering all three years, which company had the highest annual profit?
Company A
Company D
Company B
Company C
Which of the four companies experienced the highest annual loss in any of the years?
Which of the four companies experienced the highest annual loss in any of the years?
Company C
Company A
Company B
Company D
The ratio of a company's annual profit to its annual costs is a measure of its performance. Which of the four companies had the lowest value of this ratio in 2019?
The ratio of a company's annual profit to its annual costs is a measure of its performance. Which of the four companies had the lowest value of this ratio in 2019?
Company A
Company D
Company B
Company C
The total number of employees lost in 2019 and 2020 was the least for:
The total number of employees lost in 2019 and 2020 was the least for:
Company B
Company D
Company A
Company C
Profit per employee is the ratio of a company's profit to its employee strength. For this purpose, the employee strength in a year is the average of the employee strength at the beginning of that year and the beginning of the next year. In 2020, which of the four companies had the highest profit per employee?
Profit per employee is the ratio of a company's profit to its employee strength. For this purpose, the employee strength in a year is the average of the employee strength at the beginning of that year and the beginning of the next year. In 2020, which of the four companies had the highest profit per employee?
Company D
Company C
Company B
Company A
CAT 2021 QUANT Based DI questions
Question 1
Slot-1

The horizontal bars in the above diagram represent 2020 aggregate sales (in ₹ million) of a company for the different subcategories of its products. The top four product subcategories (Bookcases, Chairs, Furnishings, Tables) belong to furniture product category; the bottom four product subcategories (Accessories, Copiers, Machines, Phones) belong to the technology product category while all other product subcategories belong to the office supply product category. For each of the product subcategories, there is a vertical line indicating the sales of the corresponding subcategory in 2019.
The horizontal bars in the above diagram represent 2020 aggregate sales (in ₹ million) of a company for the different subcategories of its products. The top four product subcategories (Bookcases, Chairs, Furnishings, Tables) belong to furniture product category; the bottom four product subcategories (Accessories, Copiers, Machines, Phones) belong to the technology product category while all other product subcategories belong to the office supply product category. For each of the product subcategories, there is a vertical line indicating the sales of the corresponding subcategory in 2019.
The total sales (in ₹ million) in 2019 from products in office supplies category is closest to
The total sales (in ₹ million) in 2019 from products in office supplies category is closest to
16.5
12.5
18.0
13.5
The percentage increase in sales in Furniture category from 2019 to 2020 is closest to
The percentage increase in sales in Furniture category from 2019 to 2020 is closest to
1%
8%
20%
25%
How many subcategories had sales of ₹ 4 million or more in 2019 and registered an increase in sales in excess of 25% in 2020?
How many subcategories had sales of ₹ 4 million or more in 2019 and registered an increase in sales in excess of 25% in 2020?
The improvement index for a category is the maximum percentage increase in sales from 2019 to 2020 among any of its subcategories. The correct order of categories in increasing order of this improvement index is
The improvement index for a category is the maximum percentage increase in sales from 2019 to 2020 among any of its subcategories. The correct order of categories in increasing order of this improvement index is
office supply, technology, furniture
technology, furniture, office supply
office supply, furniture, technology
furniture, technology, office supply
Question 2
Slot-1
A journal plans to publish 18 research papers, written by eight authors (A, B, C, D, E, F, G, and H) in four issues of the journal scheduled in January, April, July and October. Each of the research papers was written by exactly one of the eight authors. Five papers were scheduled in each of the first two issues, while four were scheduled in each of the last two issues. Every author wrote at least one paper and at most three papers. The total number of papers written by A, D, G and H was double the total number of papers written by the other four authors. Four of the authors were from India and two each were from Japan and China. Each author belonged to exactly one of the three areas — Manufacturing, Automation and Logistics. Four of the authors were from the Logistics area and two were from the Automation area. As per the journal policy, none of the authors could have more than one paper in any issue of the journal.
The following facts are also known.
-
F, an Indian author from the Logistics area, wrote only one paper. It was scheduled in the October issue.
-
A was from the Automation area and did not have a paper scheduled in the October issue.
-
None of the Indian authors were from the Manufacturing area and none of the Japanese or Chinese authors were from the Automation area.
-
A and H were from different countries, but had their papers scheduled in exactly the same issues.
-
C and E, both Chinese authors from different areas, had the same number of papers scheduled. Further, E had papers scheduled in consecutive issues of the journal but C did not.
-
B, from the Logistics area, had a paper scheduled in the April issue of the journal.
-
B and G belonged to the same country. None of their papers were scheduled in the same issue of the journal.
-
D, a Japanese author from the Manufacturing area, did not have a paper scheduled in the July issue.
-
C and H belonged to different areas.
What is the correct sequence of number of papers written by B, C, E and G, respectively?
What is the correct sequence of number of papers written by B, C, E and G, respectively?
3, 1, 1, 3
1, 2, 2, 1
1, 2, 2, 3
1, 3, 3, 1
How many papers were written by Indian authors?
How many papers were written by Indian authors?
Which of the following statement(s) MUST be true?
Statement A: Every issue had at least one paper by author(s) from each country.
Statement B: Every issue had at most two papers by author(s) from each area.
Which of the following statement(s) MUST be true?
Statement A: Every issue had at least one paper by author(s) from each country.
Statement B: Every issue had at most two papers by author(s) from each area.
Only Statement A
Neither of the statements
Both the statements
Only Statement B
Which of the following statements is FALSE?
Which of the following statements is FALSE?
Every issue had exactly one paper by a Chinese author.
Every issue had at least one paper by author(s) from Automation area.
Every issue had exactly two papers by authors from Logistics area.
Every issue had exactly two papers by Indian authors.
Which of the following statements is FALSE?
Which of the following statements is FALSE?
There was exactly one paper by an author from Logistics area in the October issue.
There was exactly one paper by an author from Manufacturing area in the April issue.
There were exactly two papers by authors from Manufacturing area in the July issue.
There were exactly two papers by authors from Manufacturing area in the January issue.
Which of the following is the correct sequence of number of papers by authors from Automation, Manufacturing and Logistics areas, respectively?
Which of the following is the correct sequence of number of papers by authors from Automation, Manufacturing and Logistics areas, respectively?
6, 5, 7
6, 7, 5
5, 6, 7
6, 6, 6
CAT 2019 QUANT Based DI questions
Question 1
Slot-1
Five vendors are being considered for a service. The evaluation committee evaluated each vendor on six aspects - Cost, Customer Service,Features, Quality, Reach, and Reliability. Each of these evaluations are on a scale of 0 (worst) to 100 (perfect). The evaluation scores on these aspects are shown in the radar chart. For example, Vendor 1 obtains a score of 52 on Reliability, Vendor 2 obtains a score of 45 on Features and Vendor 3 obtains a score of 90 on Cost.

Five vendors are being considered for a service. The evaluation committee evaluated each vendor on six aspects - Cost, Customer Service,Features, Quality, Reach, and Reliability. Each of these evaluations are on a scale of 0 (worst) to 100 (perfect). The evaluation scores on these aspects are shown in the radar chart. For example, Vendor 1 obtains a score of 52 on Reliability, Vendor 2 obtains a score of 45 on Features and Vendor 3 obtains a score of 90 on Cost.
On which aspect is the median score of the five vendors the least?
On which aspect is the median score of the five vendors the least?
Customer Service
Cost
Reliability
Quality
A vendor's final score is the average of their scores on all six aspects. Which vendor has the highest final score?
A vendor's final score is the average of their scores on all six aspects. Which vendor has the highest final score?
Vendor 4
Vendor 2
Vendor 1
Vendor 3
List of all the vendors who are among the top two scorers on the maximum number of aspects is:
List of all the vendors who are among the top two scorers on the maximum number of aspects is:
Vendor 2, Vendor 3 and Vendor 4
Vendor 1 and Vendor 5
Vendor 2 and Vendor 5
Vendor 1 and Vendor 2
List of all the vendors who are among the top three vendors on all six aspects is:
List of all the vendors who are among the top three vendors on all six aspects is:
Vendor 1 and Vendor 3
None of the Vendors
Vendor 3
Vendor 1
Question 2
Slot-1
The Ministry of Home Affairs is analysing crimes committed by foreigners in different states and union territories (UT) of India. All cases refer to the ones registered against foreigners in 2016.
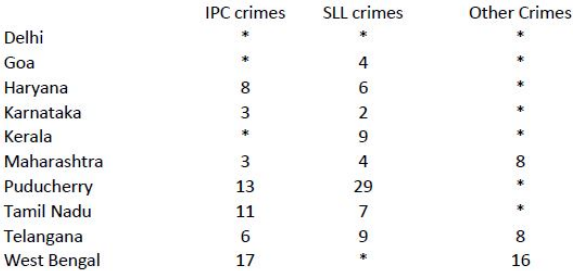
The number of cases - classified into three categories: IPC crimes, SLL crimes and other crimes - for nine states/UTs are shown in the figure below. These nine belong to the top ten states/UTs in terms of the total number of cases registered. The remaining state (among top ten) is West Bengal, where all the 520 cases registered were SLL crimes.

The table below shows the ranks of the ten states/UTs mentioned above among ALL states/UTs of India in terms of the number of cases registered in each of the three category of crimes. A state/UT is given rank r for a category of crimes if there are ( ) states/UTs having a larger number of cases registered in that category of crimes. For example, if two states have the same number of cases in a category, and exactly three other states/UTs have larger numbers of cases registered in the same category, then both the states are given rank 4 in that category. Missing ranks in the table are denoted by *.
The Ministry of Home Affairs is analysing crimes committed by foreigners in different states and union territories (UT) of India. All cases refer to the ones registered against foreigners in 2016.
The number of cases - classified into three categories: IPC crimes, SLL crimes and other crimes - for nine states/UTs are shown in the figure below. These nine belong to the top ten states/UTs in terms of the total number of cases registered. The remaining state (among top ten) is West Bengal, where all the 520 cases registered were SLL crimes.
The table below shows the ranks of the ten states/UTs mentioned above among ALL states/UTs of India in terms of the number of cases registered in each of the three category of crimes. A state/UT is given rank r for a category of crimes if there are ( ) states/UTs having a larger number of cases registered in that category of crimes. For example, if two states have the same number of cases in a category, and exactly three other states/UTs have larger numbers of cases registered in the same category, then both the states are given rank 4 in that category. Missing ranks in the table are denoted by *.
What is the rank of Kerala in the 'IPC crimes' category?
What is the rank of Kerala in the 'IPC crimes' category?
In the two states where the highest total number of cases are registered, the ratio of the total number of cases in IPC crimes to the total number in SLL crimes is closest to Ans
In the two states where the highest total number of cases are registered, the ratio of the total number of cases in IPC crimes to the total number in SLL crimes is closest to Ans
3:2
19:20
11:10
1:9
Which of the following is DEFINITELY true about the ranks of states/UT in the 'other crimes' category? i) Tamil Nadu: 2 ii) Puducherry: 3
Which of the following is DEFINITELY true about the ranks of states/UT in the 'other crimes' category? i) Tamil Nadu: 2 ii) Puducherry: 3
both i) and ii)
only ii)
neither i), nor ii)
only i)
What is the sum of the ranks of Delhi in the three categories of crimes?
What is the sum of the ranks of Delhi in the three categories of crimes?
Question 3
Slot-2
A large store has only three departments, Clothing, Produce, and Electronics. The following figure shows the percentages of revenue and cost from the three departments for the years 2016, 2017 and 2018. The dotted lines depict percentage levels. So for example, in 2016, 50% of store's revenue came from its Electronics department while of its costs were incurred in the Produce department

In this setup, Profit is computed as (Revenue – Cost) and Percentage Profit as Profit/Cost × 100%.
It is known that
-
The percentage profit for the store in 2016 was .
-
The store's revenue doubled from 2016 to 2017, and its cost doubled from 2016 to 2018.
-
There was no profit from the Electronics department in 2017.
-
In 2018 , the revenue from the Clothing department was the same as the cost incurred in the Produce department.
A large store has only three departments, Clothing, Produce, and Electronics. The following figure shows the percentages of revenue and cost from the three departments for the years 2016, 2017 and 2018. The dotted lines depict percentage levels. So for example, in 2016, 50% of store's revenue came from its Electronics department while of its costs were incurred in the Produce department
In this setup, Profit is computed as (Revenue – Cost) and Percentage Profit as Profit/Cost × 100%.
It is known that
-
The percentage profit for the store in 2016 was .
-
The store's revenue doubled from 2016 to 2017, and its cost doubled from 2016 to 2018.
-
There was no profit from the Electronics department in 2017.
-
In 2018 , the revenue from the Clothing department was the same as the cost incurred in the Produce department.
What was the percentage profit of the store in 2018 ?
What was the percentage profit of the store in 2018 ?
What was the ratio of revenue generated from the Produce department in 2017 to that in 2018?
What was the ratio of revenue generated from the Produce department in 2017 to that in 2018?
9 : 16
What percentage of the total profits for the store in 2016 was from the Electronics department?
What percentage of the total profits for the store in 2016 was from the Electronics department?
What was the approximate difference in profit percentages of the store in 2017 and 2018?
What was the approximate difference in profit percentages of the store in 2017 and 2018?
15.5
25.0
8.3
33.3
Question 4
Slot-2

Column 1 Column 2 Column 3 Row 1 Row 2 Row 3
Three pouches (each represented by a filled circle) are kept in each of the nine slots in a grid, as shown in the figure. Every pouch has a certain number of one-rupee coins. The minimum and maximum amounts of money (in rupees) among the three pouches in each of the nine slots are given in the table. For example, we know that among the three pouches kept in the second column of the first row, the minimum amount in a pouch is Rs. 6 and the maximum amount is Rs. 8.
There are nine pouches in any of the three columns, as well as in any of the three rows. It is known that the average amount of money (in rupees) kept in the nine pouches in any column or in any row is an integer. It is also known that the total amount of money kept in the three pouches in the first column of the third row is Rs. 4.
| Column 1 | Column 2 | Column 3 | |
|---|---|---|---|
| Row 1 | |||
| Row 2 | |||
| Row 3 |
Three pouches (each represented by a filled circle) are kept in each of the nine slots in a grid, as shown in the figure. Every pouch has a certain number of one-rupee coins. The minimum and maximum amounts of money (in rupees) among the three pouches in each of the nine slots are given in the table. For example, we know that among the three pouches kept in the second column of the first row, the minimum amount in a pouch is Rs. 6 and the maximum amount is Rs. 8.
There are nine pouches in any of the three columns, as well as in any of the three rows. It is known that the average amount of money (in rupees) kept in the nine pouches in any column or in any row is an integer. It is also known that the total amount of money kept in the three pouches in the first column of the third row is Rs. 4.
What is the total amount of money (in rupees) in the three pouches kept in the first column of the second row?
What is the total amount of money (in rupees) in the three pouches kept in the first column of the second row?
How many pouches contain exactly one coin?
How many pouches contain exactly one coin?
What is the number of slots for which the average amount (in rupees) of its three pouches is an integer?
What is the number of slots for which the average amount (in rupees) of its three pouches is an integer?
The number of slots for which the total amount in its three pouches strictly exceeds Rs. 10 is
The number of slots for which the total amount in its three pouches strictly exceeds Rs. 10 is
CAT 2018 QUANT Based DI questions
Question 1
Slot-2
Each of the 23 boxes in the picture below represents a product manufactured by one of the following three companies: Alfa, Bravo and Charlie. The area of a box is proportional to the revenue from the corresponding product, while its centre represents the Product popularity and Market potential scores of the product (out of 20). The shadings of some of the boxes have got erased.
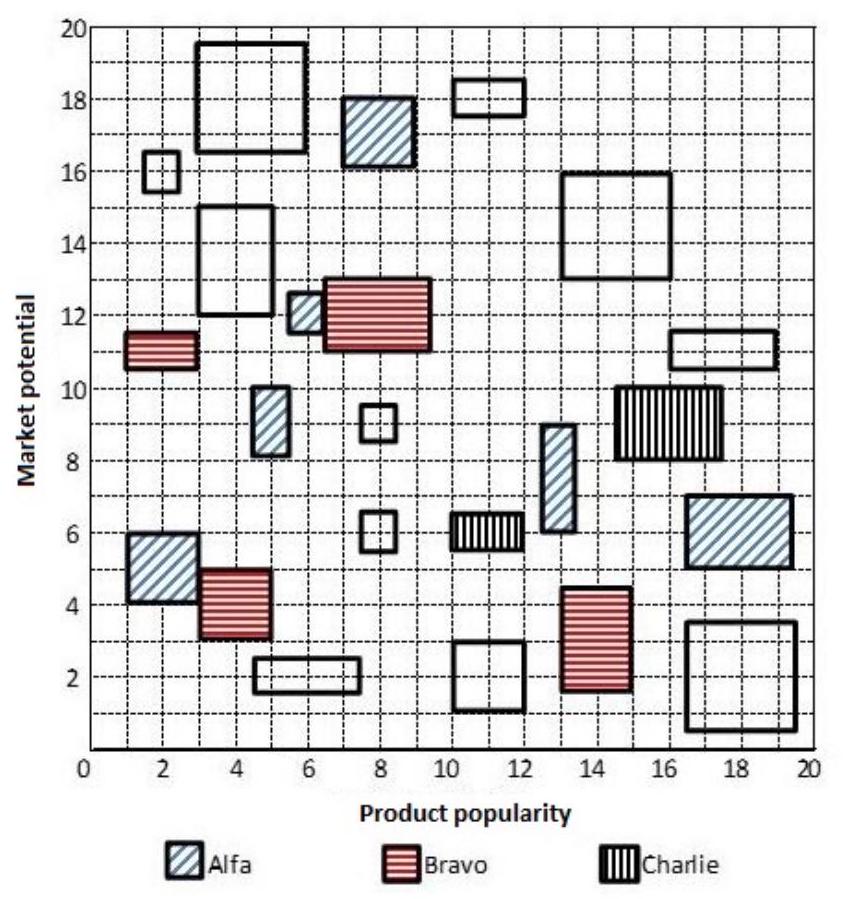
The companies classified their products into four categories based on a combination of scores (out of 20 ) on the two parameters - Product popularity and Market potential as given below:
Promising Blockbuster Doubtful No-hope Product popularity score Market potential score
The following facts are known:
-
Alfa and Bravo had the same number of products in the Blockbuster category.
-
Charlie had more products than Bravo but fewer products than Alfa in the No-hope category.
-
Each company had an equal number of products in the Promising category.
-
Charlie did not have any product in the Doubtful category, while Alfa had one product more than Bravo in this category
-
Bravo had a higher revenue than Alfa from products in the Doubtful category.
-
Charlie had a higher revenue than Bravo from products in the Blockbuster category.
-
Bravo and Charlie had the same revenue from products in the No-hope category.
-
Alfa and Charlie had the same total revenue considering all products.
Each of the 23 boxes in the picture below represents a product manufactured by one of the following three companies: Alfa, Bravo and Charlie. The area of a box is proportional to the revenue from the corresponding product, while its centre represents the Product popularity and Market potential scores of the product (out of 20). The shadings of some of the boxes have got erased.
The companies classified their products into four categories based on a combination of scores (out of 20 ) on the two parameters - Product popularity and Market potential as given below:
| Promising | Blockbuster | Doubtful | No-hope | |
|---|---|---|---|---|
| Product popularity score | ||||
| Market potential score |
The following facts are known:
-
Alfa and Bravo had the same number of products in the Blockbuster category.
-
Charlie had more products than Bravo but fewer products than Alfa in the No-hope category.
-
Each company had an equal number of products in the Promising category.
-
Charlie did not have any product in the Doubtful category, while Alfa had one product more than Bravo in this category
-
Bravo had a higher revenue than Alfa from products in the Doubtful category.
-
Charlie had a higher revenue than Bravo from products in the Blockbuster category.
-
Bravo and Charlie had the same revenue from products in the No-hope category.
-
Alfa and Charlie had the same total revenue considering all products.
Considering all companies' products, which product category had the highest revenue?
Considering all companies' products, which product category had the highest revenue?
No-hope
Blockbuster
Doubtful
Promising
Which of the following is the correct sequence of numbers of products Bravo had in No-hope, Doubtful, Promising and Blockbuster categories respectively?
Which of the following is the correct sequence of numbers of products Bravo had in No-hope, Doubtful, Promising and Blockbuster categories respectively?
Which of the following statements is NOT correct?
Which of the following statements is NOT correct?
Alfa's revenue from Blockbuster products was the same as Charlie's revenue from Promising products
Bravo's revenue from Blockbuster products was greater than Alfa's revenue from Doubtful products
Bravo and Charlie had the same revenues from No-hope products
The total revenue from No-hope products was less than the total revenue from Doubtful products
If the smallest box on the grid is equivalent to revenue of Rs. 1 crore, then what approximately was the total revenue of Bravo in Rs. crore?
If the smallest box on the grid is equivalent to revenue of Rs. 1 crore, then what approximately was the total revenue of Bravo in Rs. crore?
40
24
34
30
Loading...