7 Line Bar Graphs PYQ (Solutions)
Master Line Bar Graphs for CAT 2026 with practice questions and detailed explanations
Line and Bar Graph DI Sets
Line and bar graphs are classic DI formats. CAT almost every year includes a set with a bar graph or line chart to interpret.
- CAT 2017: Featured a difficult-to-understand bar graph in one slot.
- CAT 2018:
- Slot 1: Easy Pie-Chart (percentages)
- Slot 2: “Square chart” and profitability vs market share graph (bar/line chart interpretations)
- CAT 2019:
- Slot 1: Radar (spider-web) graph
- Slot 2: Horizontal bar chart on crime rates
- CAT 2020–2021: Graph-based sets continued; 2021 Slot 1 had a horizontal bar chart on revenue (easy DI set).
- CAT 2024: Slot 1 included a scatter-plot graph DI set (easy-moderate).
Key Insights:
- Graphical DI sets (bar, line, pie, scatter, etc.) appear every year.
- Usually 1–2 sets per exam are graph-based.
- Difficulty varies depending on how the data needs to be interpreted or combined.
Weightage Over Past Years
| Year | Q.NONumber of questions | Difficulty Level |
|---|---|---|
| 2025 | 2 | Hard |
| 2024 | 2 | Hard |
| 2021 | 2 | Medium |
| 2017 | 1 | Hard |
CAT 2025 Line Bar Graphs questions
Question 1
Slot-1
Five countries engage in trade with each other. Each country levies import tariffs on the other countries. The import tariff levied by Country X on Country Y is calculated by multiplying the corresponding tariff percentage with the total imports of Country X from Country Y.
The radar chart below depicts different import tariff percentages charged by each of the five countries on the others. For example, US (the blue line in the chart) charges 20%, 40%, 30%, and 30% import tariff percentages on imports from France, India, Japan, and UK, respectively. The bar chart depicts the import tariffs levied by each county on other countries. For example, US charged import tariff of 3 billion USD on UK.

 Assume that imports from one country to another equals the exports from the latter to the former.
The trade surplus of Country X with Country Y is defined as follows.
Trade surplus = Exports from Country X to Country Y – Imports to Country X from Country Y.
A negative trade surplus is called trade deficit.
Five countries engage in trade with each other. Each country levies import tariffs on the other countries. The import tariff levied by Country X on Country Y is calculated by multiplying the corresponding tariff percentage with the total imports of Country X from Country Y.
The radar chart below depicts different import tariff percentages charged by each of the five countries on the others. For example, US (the blue line in the chart) charges 20%, 40%, 30%, and 30% import tariff percentages on imports from France, India, Japan, and UK, respectively. The bar chart depicts the import tariffs levied by each county on other countries. For example, US charged import tariff of 3 billion USD on UK.
Assume that imports from one country to another equals the exports from the latter to the former.
The trade surplus of Country X with Country Y is defined as follows. Trade surplus = Exports from Country X to Country Y – Imports to Country X from Country Y.
A negative trade surplus is called trade deficit.
How much is Japan's export to India worth?
How much is Japan's export to India worth?
7.0 Billion USD
1.75 Billion USD
16.0 Billion USD
8.5 Billion USD
Which among the following is the highest?
Which among the following is the highest?
Imports by US from France
Exports by France to Japan
Exports by Japan to UK
Imports by France from India
What is the trade surplus/trade deficit of India with UK?
What is the trade surplus/trade deficit of India with UK?
Deficit of 15.0 Billion USD
Deficit of 10.0 Billion USD
Surplus of 10.0 Billion USD
Surplus of 15.0 Billion USD
Among France and UK, who has/have trade surplus(es) with US?
Among France and UK, who has/have trade surplus(es) with US?
Neither France nor UK
Only UK
Both France and UK
Only France
Question 2
Slot-3
Anirbid, Chandranath, Koushik, and Suranjan participated in a puzzle solving
competition. The competition comprised 10 puzzles that had to be solved in the same
sequence, i.e., a competitor got access to a puzzle as soon as they solved the previous
puzzle. Some of the puzzles were visual puzzles and the others were number-based puzzles.
The winner of the competition was the one who solved all puzzles in the least time.
The following charts describe their progress in the competition. The chart on the left
shows the number of puzzles solved by each competitor at a given time (in minutes) after the
start of the competition. The chart on the right shows the number of visual puzzles solved
by each competitor at a given time (in minutes) after the start of the
competition.

Anirbid, Chandranath, Koushik, and Suranjan participated in a puzzle solving competition. The competition comprised 10 puzzles that had to be solved in the same sequence, i.e., a competitor got access to a puzzle as soon as they solved the previous puzzle. Some of the puzzles were visual puzzles and the others were number-based puzzles. The winner of the competition was the one who solved all puzzles in the least time.
The following charts describe their progress in the competition. The chart on the left shows the number of puzzles solved by each competitor at a given time (in minutes) after the start of the competition. The chart on the right shows the number of visual puzzles solved by each competitor at a given time (in minutes) after the start of the competition.
Who had solved the largest number of puzzles by the 20-th minute from the start of the
competition?
Who had solved the largest number of puzzles by the 20-th minute from the start of the competition?
Chandranath
Koushik
Anirbid
Suranjan
How many minutes did Suranjan take to solve the third visual puzzle in the competition?
How many minutes did Suranjan take to solve the third visual puzzle in the competition?
At what number in the sequence was the fourth number-based puzzle?
At what number in the sequence was the fourth number-based puzzle?
Which of the following is the closest to the average time taken by Anirbid to solve the
number-based puzzles in the competition?
Which of the following is the closest to the average time taken by Anirbid to solve the number-based puzzles in the competition?
3.3 minutes
2.5 minutes
4.0 minutes
3.8 minutes
CAT 2024 Line Bar Graphs questions
Question 1
Slot-1
Six web surfers , and Y each had 30 stars which they distributed among four bloggers , and D . The number of stars received by and from the six web surfers is shown in the figure below.
No.of Stars received by Bloggers A and B

The following additional facts are known regarding the number of stars received by the bloggers from the surfers.
- The numbers of stars received by the bloggers from the surfers were all multiples of 5 (including 0 ).
- The total numbers of stars received by the bloggers were the same.
- Each blogger received a different number of stars from .
- Two surfers gave all their stars to a single blogger.
- received more stars than from .
Six web surfers , and Y each had 30 stars which they distributed among four bloggers , and D . The number of stars received by and from the six web surfers is shown in the figure below.
No.of Stars received by Bloggers A and B
The following additional facts are known regarding the number of stars received by the bloggers from the surfers.
- The numbers of stars received by the bloggers from the surfers were all multiples of 5 (including 0 ).
- The total numbers of stars received by the bloggers were the same.
- Each blogger received a different number of stars from .
- Two surfers gave all their stars to a single blogger.
- received more stars than from .
What was the total number of stars received by ?
What was the total number of stars received by ?
What was the number of stars received by from ?
What was the number of stars received by from ?
5
10
Cant be determined
0
How many surfers distributed their stars among exactly 2 bloggers?
How many surfers distributed their stars among exactly 2 bloggers?
Which of the following can be determined with certainty? I. The number of stars received by C from M II. The number of stars received by D from O
Which of the following can be determined with certainty? I. The number of stars received by C from M II. The number of stars received by D from O
Neither I or II
Only I
Only II
Both I and II
Question 2
Slot-2
An online e-commerce firm receives daily integer product ratings from 1 through 5 given by buyers. The daily average is the average of the ratings given on that day. The cumulative average is the average of all ratings given on or before that day. The rating system began on Day 1, and the cumulative averages were 3 and 3.1 at the end of Day 1 and Day 2, respectively. The distribution of ratings on Day 2 is given in the figure below.
Distribution of Rating on Day 2

The following information is known about ratings on Day 3.
- 100 buyers gave product ratings on Day 3.
- The modes of the product ratings were 4 and 5.
- The numbers of buyers giving each product rating are non-zero multiples of 10.
- The same number of buyers gave product ratings of 1 and 2 , and that number is half the number of buyers who gave a rating of 3 .
An online e-commerce firm receives daily integer product ratings from 1 through 5 given by buyers. The daily average is the average of the ratings given on that day. The cumulative average is the average of all ratings given on or before that day. The rating system began on Day 1, and the cumulative averages were 3 and 3.1 at the end of Day 1 and Day 2, respectively. The distribution of ratings on Day 2 is given in the figure below.
Distribution of Rating on Day 2
The following information is known about ratings on Day 3.
- 100 buyers gave product ratings on Day 3.
- The modes of the product ratings were 4 and 5.
- The numbers of buyers giving each product rating are non-zero multiples of 10.
- The same number of buyers gave product ratings of 1 and 2 , and that number is half the number of buyers who gave a rating of 3 .
How many buyers gave ratings on Day 1?
How many buyers gave ratings on Day 1?
What is the daily average rating of Day 3?
What is the daily average rating of Day 3?
3.6
3.0
3.2
3.5
What is the median of all ratings given on Day 3?
What is the median of all ratings given on Day 3?
Which of the following is true about the cumulative average ratings of Day 2 and Day 3?
Which of the following is true about the cumulative average ratings of Day 2 and Day 3?
The cumulative average of Day 3 increased by less than from Day 2.
The cumulative average of Day 3 decreased from Day 2.
The cumulative average of Day 3 increased by a percentage between and from Day 2 .
The cumulative average of Day 3 increased by more than 8% from Day 2.
CAT 2021 Line Bar Graphs questions
Question 1
Slot-2
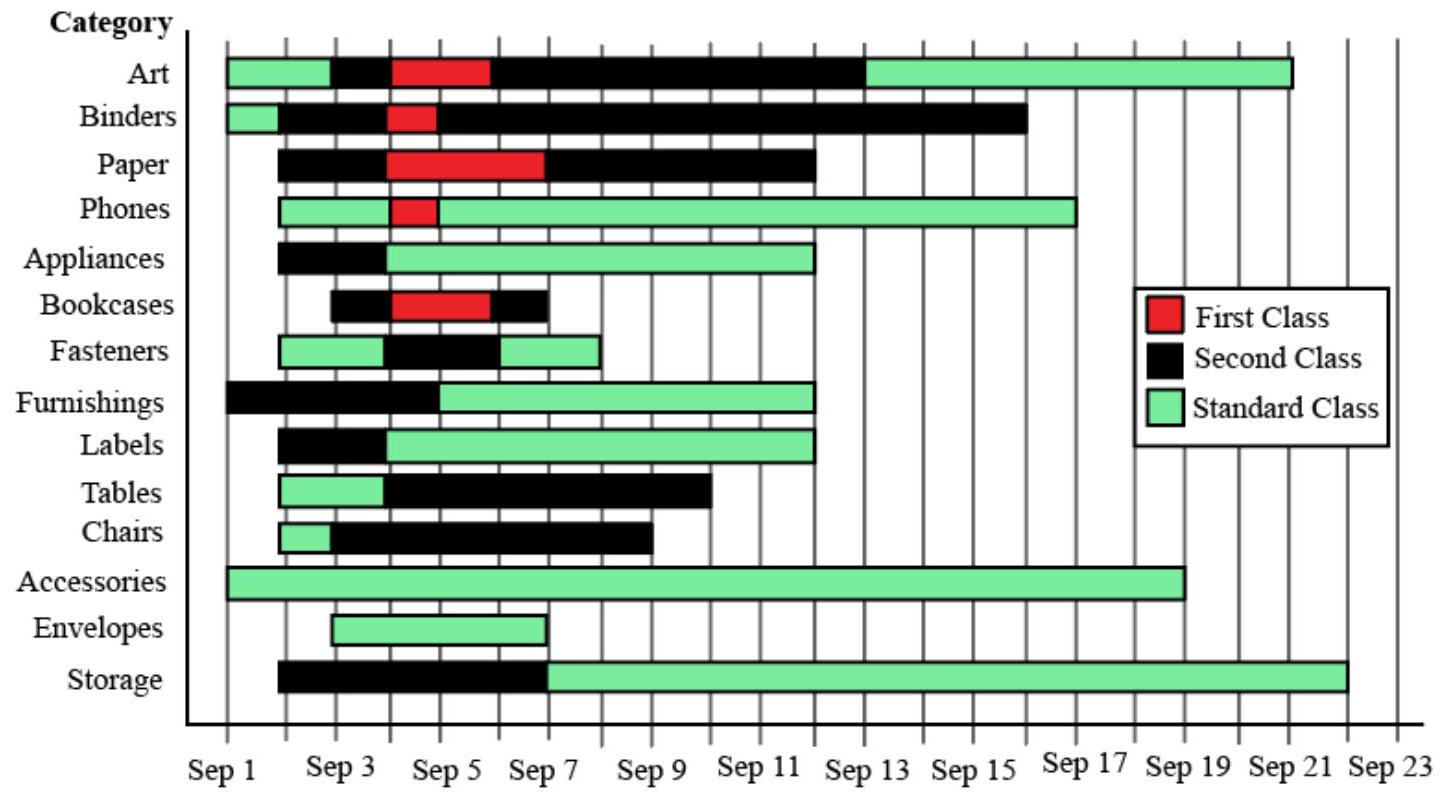
The different bars in the diagram above provide information about different orders in various categories (Art, Binders, ....) that were booked in the first two weeks of September of a store for one client. The colour and pattern of a bar denotes the ship mode (First Class / Second Class / Standard Class). The left end point of a bar indicates the booking day of the order, while the right end point indicates the dispatch day of the order. The difference between the dispatch day and the booking day (measured in terms of the number of days) is called the processing time of the order. For the same category, an order is considered for booking only after the previous order of the same category is dispatched. No two consecutive orders of the same category had identical ship mode during this period.
For example, there were only two orders in the furnishing category during this period. The first one was shipped in the Second Class. It was booked on Sep 1 and dispatched on Sep 5. The second order was shipped in the Standard class. It was booked on Sep 5 (although the order might have been placed before that) and dispatched on Sep 12. So the processing times were 4 and 7 days respectively for these orders.
How many days between Sep 1 and Sep 14 (both inclusive) had no booking from this client considering all the above categories?
How many days between Sep 1 and Sep 14 (both inclusive) had no booking from this client considering all the above categories?
What was the average processing time of all orders in the categories which had only one type of ship mode?
What was the average processing time of all orders in the categories which had only one type of ship mode?
The sequence of categories -- Art, Binders, Paper and Phones -- in decreasing order of average processing time of their orders in this period is:
The sequence of categories -- Art, Binders, Paper and Phones -- in decreasing order of average processing time of their orders in this period is:
Art, Binders, Paper, Phones
Phones, Art, Binders, Paper
Phones, Binders, Art, Paper
Paper, Binders, Art, Phones
Approximately what percentage of orders had a processing time of one day during the period Sep 1 to Sep 22 (both dates inclusive)?
Approximately what percentage of orders had a processing time of one day during the period Sep 1 to Sep 22 (both dates inclusive)?
16%
25%
Question 2
Slot-3

The figure above shows the schedule of four employees – Abani, Bahni, Danni and Tinni – whom Dhoni supervised in 2020. Altogether there were five projects which started and concluded in 2020 in which they were involved. For each of these projects and for each employee, the starting day was at the beginning of a month and the concluding day was the end of a month, and these are indicated by the left and right end points of the corresponding horizontal bars. The number within each bar indicates the percentage of assigned work completed by the employee for that project, as assessed by Dhoni.
For each employee, his/her total project-month (in 2020) is the sum of the number of months (s)he worked across the five project, while his/her annual completion index is the weightage average of the completion percentage assigned from the different projects, with the weights being the corresponding number of months (s)he worked in these projects. For each project, the total employee-month is the sum of the number of months four employees worked in this project, while its completion index is the weightage average of the completion percentage assigned for the employees who worked in this project, with the weights being the corresponding number of months they worked in this project.
Which of the following statements is/are true?
I: The total project-month was the same for the four employees.
II: The total employee-month was the same for the five projects.
Which of the following statements is/are true?
I: The total project-month was the same for the four employees.
II: The total employee-month was the same for the five projects.
Neither I nor II
Only II
Both I and II
Only I
Which employees did not work in multiple projects for any of the months in 2020?
Which employees did not work in multiple projects for any of the months in 2020?
Only Abani and Bahni
All four of them
Only Tinni
Only Abani, Bahni and Danni
The project duration, measured in terms of the number of months, is the time during which at least one employee worked in the project. Which of the following pairs of the projects had the same duration?
The project duration, measured in terms of the number of months, is the time during which at least one employee worked in the project. Which of the following pairs of the projects had the same duration?
Project 3, Project 5
Project 1, Project 5
Project 4, Project 5
Project 3, Project 4
The list of employees in decreasing order of annual completion index is:
The list of employees in decreasing order of annual completion index is:
Danni, Tinni, Bahni, Abani
Bahni, Abani, Tinni, Danni
Danni, Tinni, Abani, Bahni
Tinni, Danni, Abani, Bahni
CAT 2017 Line Bar Graphs questions
Question 1
Slot-2
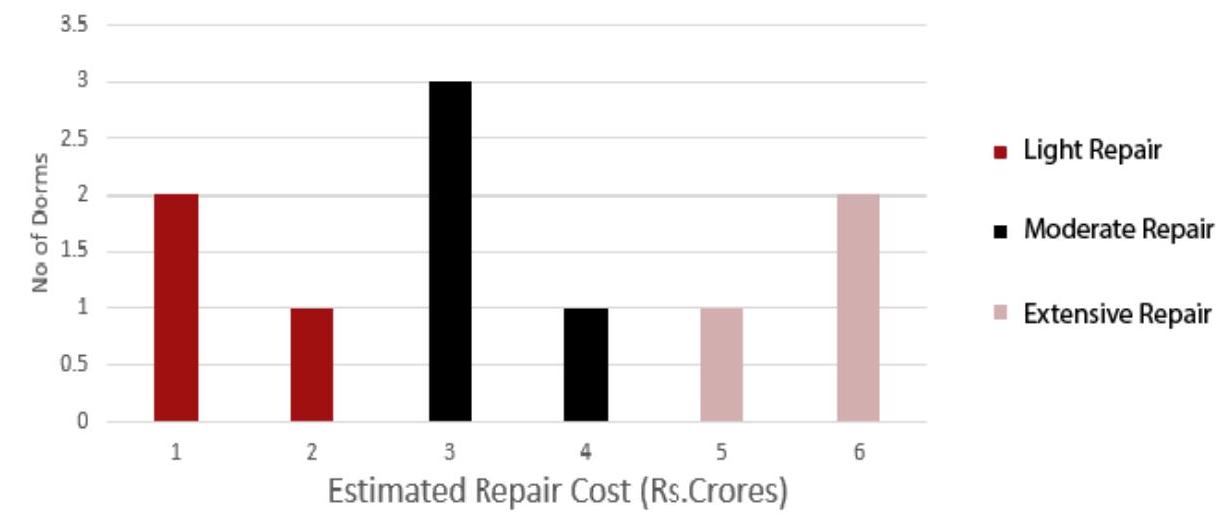
At a management school, the oldest M dorms, numbered 1 to 10, need to be repaired urgently. This following diagram represents the estimated repair costs (in Rs. Crores for, the 10 dorms. For any dorm, the estimated repair cost (in Rs. Crores) is an integer. Repairs with estimated cost Rs. 1 or 2 Crores are considered light repairs, repairs with estimated cost Rs. 3 or 4 are considered moderate repairs and repairs with estimated cost Rs. 5 or 6 Crores are considered extensive repairs.
Further, the following information is known.
-
Odd-numbered dorms do not need light repair; even-numbered dorms do not need moderate repair and dorms, whose numbers are divisible by 3, do not need extensive repair.
-
Dorms 4 to 9 all need different repair costs, with Dorm 7 needing the maximum and Dorm 8 needing the minimum.
Which of the following is NOT necessarily true?
Which of the following is NOT necessarily true?
Dorm 1 needs a moderate repair
Dorm 5 repair will cost no more than Rs. 4 Crores
Dorm 7 needs an extensive repair
Dorm 10 repair will cost no more than Rs. 4 Crores
What is the total cost of repairing the odd-numbered dorms (in Rs. Crores)?
What is the total cost of repairing the odd-numbered dorms (in Rs. Crores)?
Suppose further that:
Suppose further that:
Suppose further that: 1 4 of the 10 dorms needing repair are women's dorms and need a total of Rs. 20 Crores for repair. 2 Only one of Dorms 1 to 5 is a women's dorm. Which of the following is a women's dorm?
Suppose further that: 1 4 of the 10 dorms needing repair are women's dorms and need a total of Rs. 20 Crores for repair. 2 Only one of Dorms 1 to 5 is a women's dorm. Which of the following is a women's dorm?
Dorm 2
Dorm 5
Dorm 8
Dorm 10
Loading...