
Reading a B-School Placement Report: 5 Misleading Numbers
Every placement season brings headlines about record packages and near perfect placement. Aspirants read them while choosing where to apply, and the numbers feel like facts. Most of them are true. Many are also incomplete, and an incomplete number can point you in the wrong direction.
This guide covers five numbers in a placement report that often mislead, with small examples you can verify by hand. It also lists the questions to ask of any report. It does not name institutes or rank them. It teaches you to read the numbers, so you can read any report with the same care.
Placements are only one input to your choice. Your percentile also shapes which schools you can reach, and a CAT percentile predictor can give you a rough range to plan around.
- The highest package is a single outlier and says almost nothing about a typical student.
- An average can be pulled up by a few large offers, so look for the median.
- Placed percentage depends on the denominator, since some reports count only students who opted in.
- CTC includes variable pay, bonuses and sometimes stock options, so compare the fixed part.
- Batch size, sector mix and the year of the data decide whether two reports can be compared.
Why Placement Numbers Need Careful Reading
A placement report is a marketing document as well as an information document. It is written by the institute, for a mixed audience of applicants, recruiters and media. Institutes choose which numbers to feature, and they naturally feature the flattering ones.
That does not mean the numbers are false. It means each number answers one question and may not answer yours. The highest package answers what is the best case. It does not answer what is typical. The average answers a different question again.
Your question as an aspirant is usually: what is a typical outcome for someone like me, and how reliable is it? To answer that, you need to read past the headline numbers and find the ones that describe the middle of the batch. The five below are where the gaps are most common.
Number One: The Highest Package
The highest package is the single largest offer in the batch. It is real, and it is also a sample of one. It tells you the ceiling of what recruiters were willing to pay one student, perhaps for a rare profile or a special role.
A highest package of several times the average usually means one or a few students received something unusual. The offer may also be for an overseas posting, with a different cost structure, or may include components that are not cash. It is worth noticing, but it should barely move your expectations for yourself.
A useful habit is to ignore the highest package and look at the range. How many students received offers above a given level? How many were near the lower end? The spread tells you much more than the top.
Using the highest package as a proxy for the quality of the programme. It is a number about one person. A school with a lower highest package may have a higher typical outcome, and the reverse is also possible.
Number Two: The Average Package
The average, or mean, adds every package and divides by the number of students. A few very large offers pull it up. The median is the middle value when packages are sorted, and it is not affected by outliers in the same way.
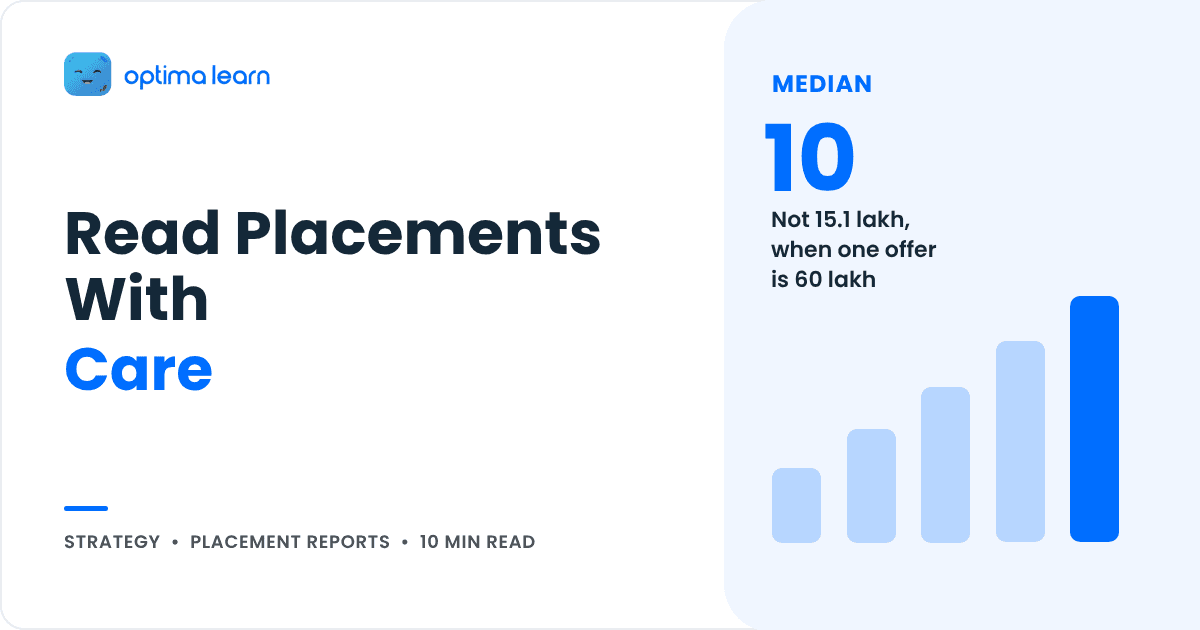
A small example makes the point. Ten students receive packages, in lakhs, of 9, 9, 9, 10, 10, 10, 11, 11, 12 and 60. The sum is 151, so the average is 15.1 lakh. The median is the average of the fifth and sixth values, which are both 10, so it is 10 lakh. Nine of the ten students received 12 lakh or less. The average of 15.1 describes none of them.
When a report gives both the average and the median, the gap between them tells you how skewed the offers are. A large gap suggests a few big outliers. When a report gives only the average, treat it as an upper estimate of what a typical student received.
| Measure | What it tells you | How it can mislead |
|---|---|---|
| Highest package | The best single offer | One student, not typical |
| Average package | Mean of all offers | Pulled up by outliers |
| Median package | Middle offer | Rarely reported, more reliable |
| Lowest quartile | What the lower part of the batch got | Often not reported |
Number Three: The Placed Percentage
Placed percentage looks simple: students placed divided by students in the batch. The catch is the denominator. Some reports divide by all students. Others divide only by the students who opted in to the placement process. Students who did not opt in, because they were entrepreneurs, had family businesses or took up sponsored roles, are left out.
Take a batch of 120 students. If 100 opted in and 95 were placed, the report can say 95 percent placed. If you divide by the whole batch, it is 95 over 120, which is about 79 percent. Both numbers are true. They describe different groups, and the first is flattering.
Ask what the denominator is. Look for a footnote that explains how many students opted in and how many did not. Also ask when the count was taken. A report written at the end of the placement season may show a higher figure than one written at an earlier point.
Number Four: CTC and What Is Inside It
CTC, or cost to company, is a sum of several things. It may include fixed pay, variable pay, joining bonus, relocation support and sometimes the value of stock options. Two packages of the same CTC can be very different in what reaches you each month.
For example, a package of 30 lakh might be made of 18 lakh fixed, 6 lakh variable, 4 lakh in stock options and 2 lakh as a joining bonus. The fixed part is 60 percent of the CTC. The variable depends on performance and the options depend on the company and on time. A second package of 26 lakh with 22 lakh fixed gives you more predictable income, even though the headline number is lower.
When you compare reports, ask whether the figures are CTC or fixed pay, and whether stock options are valued at grant or at some estimate. A report that shows the fixed share is more useful than one that shows only the total. I would treat any package that is largely variable or stock based as less certain, and this is general information, not financial advice.
- Look for the median, not just the average.
- Check the denominator of the placed percentage.
- Ask what share of the CTC is fixed pay.
Get Your School Shortlist Reviewed
Choosing between schools and unsure how to weigh placement data? Share your profile and plan for a focused read.
Review My School PlanNumber Five: Batch Size, Sector Mix and the Year
The fifth source of confusion is context. A report from a batch of 60 and a report from a batch of 600 are not directly comparable. Small batches swing widely with a few offers, and large batches have more middle ground. Always note the size of the batch before comparing averages.
Sector mix matters too. A batch heavy in consulting or finance may show a different pattern from one heavy in technology or operations. If your interests lie in one sector, a school with strong placement in that sector may suit you better than one with a higher overall average. Look for the sector breakdown if the report provides it.
Finally, check the year. Placement outcomes move with the economy, and a number from a strong year may not repeat. Compare reports from the same year, and look at several years if available. A trend over three years is more informative than a single record.
Questions to Ask of Any Report
You do not need to memorise rules. A short list of questions will serve you with any report. What is the median, and how far is it from the average? What is the denominator of the placed percentage? How much of the CTC is fixed? How large was the batch? Which sectors and roles did students join? Which year is the data from?
If a report does not answer one of these, that is information. It may be in a separate document, or it may not be published. You can ask the institute directly, and speaking to current students or alumni can fill gaps. Treat a single conversation as an anecdote, not data, and ask several people.
Remember that placement is one factor among several. Fit, location, cost, faculty, peers and the kind of work you want matter too. Our guide on cutoffs for NIT and IIT MBA programmes compared shows how to place schools against your percentile range, and the article on how much work experience adds in selection helps you see how profile affects calls.
The Five Number Check
- Highest package: note it, then set it aside.
- Average and median: look for the gap between them.
- Placed percentage: find the denominator.
- CTC: find the fixed share.
- Context: note batch size, sector mix and year.
Using Placement Data in Your Own Plan
Use the data to compare, not to predict. If two schools are within your reach, compare their medians, the fixed share of pay, sector mix and batch size. If the differences are small, other factors should decide. If they are large and consistent over several years, that is worth weighing.
Also think about your own profile. A fresher and an experienced candidate often follow different paths, and a report that mixes them hides the difference. Check whether the report separates them. If you have experience, look at what students with similar backgrounds did.
Keep your own targets realistic. Your percentile and profile decide which schools you can reach, and the shortlist and interview stages come after the result. A CAT study planner can hold your preparation timeline, and you can talk to a CAT mentor who has been through the process for a view on specific schools.
Make a one page comparison sheet with the same rows for every school: median, average, fixed share, placed percentage with denominator, batch size and year. Filling it forces you to find each number, and the blanks show which schools reported less than others.
Aspirants who talk to alumni often learn more than they do from the report. The report shows the average. The alumnus can tell you what the roles were like, how the recruiters behaved and what the first year felt like. Use both, and weigh each for what it can tell you.
- Can you find the median in a report, or do you only see the average?
- Do you know the denominator of the placed percentage?
- Do you know how much of the CTC is fixed?
- Are you comparing reports from the same year and similar batch sizes?
Plan Your Preparation Around Your Target
Choosing a school starts with knowing your likely range. Put your preparation on a calendar, and revisit your list after the result.
Plan My PreparationFrequently Asked Questions About Reading a B-School Placement Report
Why is the highest package misleading?
It is a single offer, often unusual, and says little about what a typical student received. Look at the median and the spread instead.
What is the difference between average and median package?
The average adds all packages and divides by the count, so outliers pull it up. The median is the middle value and is less affected by outliers.
How is placed percentage calculated?
It depends on the report. Some divide by the whole batch and others only by students who opted in, so check the denominator.
What should I check inside CTC?
Check how much is fixed pay, how much is variable, and whether stock options or joining bonuses are included. The fixed share is the most predictable part.
Build your CAT 2026 study plan
Personalised daily plan that adapts to your section-wise mock scores.
More from Strategy
Continue reading

XAT 2027 Application Form: A 6 Step Checklist Before 6 Dec

CAT 2026 Sessions: Reported Timings and Admit Card Checks

MAH-MBA CET 2027: Pattern, Expected Timeline, and CAT

Study Music and Background Noise: What Helps VARC and DILR
Put it into practice