Data Interpretation for CAT 2026: Bar Graphs, Pie Charts, Caselets and Tables Decoded
A CAT 2026 data interpretation guide built around a 3-minute reading framework that applies to every CAT DI chart type: bar graphs (single, multiple, stacked), pie charts with angle-to-percentage shortcuts, tables with row-column totals, and caselets via 2x2 text extraction. The blog includes 4 fully solved CAT-level DI sets, an 11-13 minute pacing plan, and three reflexes that lift DI accuracy from 60% to 90% in two weeks of focused practice.
Data Interpretation for CAT 2026: Bar Graphs, Pie Charts, Caselets and Tables Decoded

Data interpretation CAT 2026 is half of the DILR section, contributing 8 to 10 of 22 questions and 11 to 14 raw marks. DI sets reward reading speed plus percentage arithmetic, which makes them the most teachable sub-topic in DILR. This blog walks through a 3-minute reading framework that applies to every CAT DI chart type, then decodes 4 standard formats (bar graphs, pie charts, caselets, tables) with full solved-set examples.
The reason most aspirants underperform on CAT DI is not lack of arithmetic ability; it is poor chart reading discipline. Reading the same chart twice wastes 2 to 3 minutes per set, which compounds across 2 to 3 DI sets per paper. The 3-minute reading framework eliminates re-reads and lifts DI accuracy from 60% to 90% with two weeks of practice.
Why DI Rewards Reading Discipline Over Arithmetic
CAT DI sets present the same arithmetic operations (percentages, ratios, growth rates, sums) inside different visual structures. The arithmetic itself is identical to Quants Arithmetic. The difference is the data extraction layer between the chart and the calculation. Aspirants who treat DI as arithmetic spend 4 to 5 minutes per question because each calculation requires a fresh chart read. Aspirants who treat DI as reading-plus-arithmetic spend 3 minutes annotating the chart upfront and then 60 to 90 seconds per question on calculation only.
The 3-minute reading framework formalises the reading-first approach. It pays back many times over across the 4 to 5 questions in a DI set.
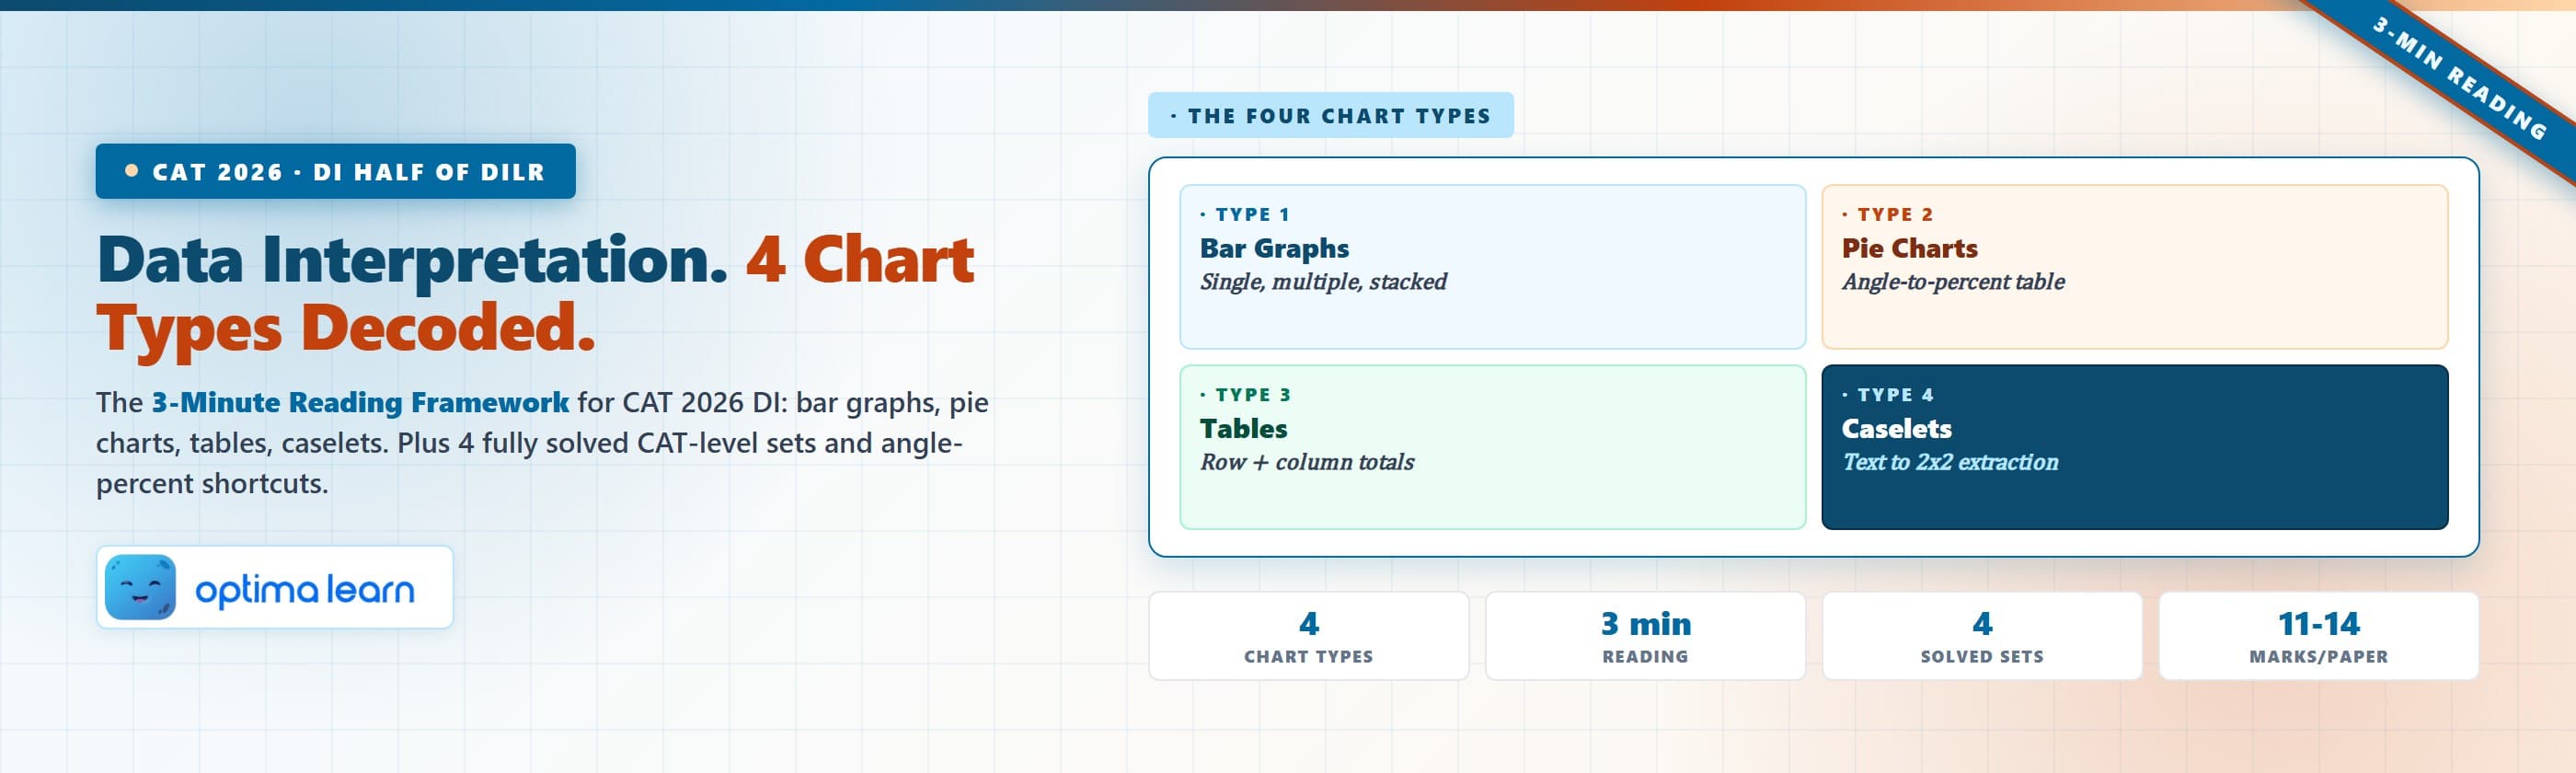
The 4 Data Interpretation Chart Types CAT Recycles
Bar graphs show categories on one axis and values on the other. Single bar graphs have one series; multiple bar graphs have 2 to 4 series side by side; stacked bar graphs split each bar into sub-categories. CAT 2026 typically uses multiple or stacked bar graphs. Recognition cue: rectangular vertical or horizontal bars with a numerical axis. Read-time: 90 seconds to extract axis labels, series legend, and 1 or 2 baseline values.
Pie charts show percentage shares of a total. Single pie charts have 4 to 8 segments; comparison pie charts have 2 to 3 pies side by side. Memorise angle-to-percentage conversions: 90 degrees = 25%, 60 degrees = 16.67%, 45 degrees = 12.5%, 36 degrees = 10%. CAT 2026 sometimes gives percentages directly; sometimes gives angles. Recognition cue: circular chart with wedge segments. Read-time: 60 to 90 seconds.
Tables list values in rows and columns. CAT tables typically have 4 to 6 rows and 3 to 5 columns. Tables are the densest DI format because every cell carries data. Recognition cue: tabular structure with headers. Read-time: 120 seconds to extract row labels, column labels, and identify which cells the question is referencing.
Caselets present data as text rather than visual chart. Example: "In a survey of 1000 employees, 60% are male, of which 25% are managers." The candidate extracts data into a mental table. Recognition cue: data presented in paragraphs without chart visuals. Read-time: 2 to 3 minutes because text reading is slower than chart scanning.
The 3-Minute Reading Framework Applied to Each Type
| Phase | Action | Detail |
|---|---|---|
| 0 to 60 sec | Extract structure | Axis labels, units, total values, scale. Note baseline if non-zero. |
| 60 to 120 sec | Annotate key values | Write totals at top. Mark percentage shares directly on chart. Compute one or two largest values. |
| 120 to 180 sec | Read question set | Read all 4 to 5 questions before solving. Identify which can be answered immediately from annotations. |
4 Fully Solved CAT-Level DI Set Walkthroughs
Five companies A, B, C, D, E with annual revenue (Rs crore) over 5 years. Year 1: A=80, B=120, C=60, D=100, E=140. Year 5: A=140, B=180, C=110, D=130, E=200. Questions: (a) Which company had the highest growth percentage? (b) Total revenue in Year 5? Approach: annotate Year 1 total = 500, Year 5 total = 760. Growth % per company: A=75%, B=50%, C=83.3%, D=30%, E=42.9%. (a) C highest. (b) 760 Rs crore.
Six brands P, Q, R, S, T, U share a 4000-crore market. Angles: P=90, Q=72, R=54, S=72, T=36, U=36. Convert: P=25%, Q=20%, R=15%, S=20%, T=10%, U=10% (totals 100). Revenue: P=1000, Q=800, R=600, S=800, T=400, U=400. Q1: Combined revenue of P and Q? Answer: 1800 crore. Q2: Ratio of S to T? Answer: 2:1.
Table with 4 products (W, X, Y, Z) and 4 quarters (Q1-Q4). Annotation: row totals (annual sales per product) and column totals (quarterly sales). Q1 totals: W=200, X=160, Y=120, Z=80 (Q1 total=560). Annual: W=900, X=720, Y=540, Z=360 (grand total=2520). Question: Which quarter had the highest sales? Use column totals to answer in 5 seconds.
"A school surveyed 1000 students. 600 prefer cricket, of whom 40% are girls. Of those who prefer football, 25% are girls. The rest prefer hockey." Extraction: Cricket=600 (Girls=240, Boys=360). Football=300 (assumed; let's compute). Hockey=100 (rest). Football: 25% girls means 0.25 * Football. Need total Football. Actually we need to deduce: 1000 students; cricket=600; football+hockey=400. If football=300, hockey=100. Girls in football=75. Total girls=240+75 = 315. Boys=685. Question: How many boys prefer cricket? Answer: 360.
How to Pace a CAT DI Set in 11-13 Minutes
| Time | Phase | Goal |
|---|---|---|
| 0 to 3 min | Reading + annotation | Extract structure, write totals, mark percentages on chart. |
| 3 to 4 min | Read all 4-5 questions | Identify quick-answer questions; order by difficulty. |
| 4 to 10 min | Solve all questions | Average 60-90 seconds per question with annotated chart. |
| 10 to 12 min | Verify and submit | Cross-check 2-3 answers against the chart. |
Lift Your DI Score with the 3-Minute Reading Framework
DI is the most teachable DILR sub-topic. A diagnostic-driven plan installs the 3-minute reading framework across the 4 chart types in 2 weeks of focused practice.
Lift My DI Reading DisciplineWhere DI Fits in the CAT 2026 DILR Plan
DI is the higher-volume half of DILR. Prioritise DI sets in the first 30 minutes of the section because their score-to-time ratio is favourable. A 2-week DI sprint with the 3-minute reading framework lifts an aspirant from 60% to 90% accuracy. The Optima Learn CAT exam guide sequences DI alongside LR sub-topics, and the CAT 2026 waitlist details page explains how the planner schedules the DILR cluster.
Three Reflexes That Compress DI Solves to 11 Minutes
Once the 3-minute reading framework is automated, three reflexes separate aspirants who finish in 11 minutes from those who take 15. Reflex one: annotate before solving. Never skip the 3-minute reading phase. Reflex two: axis-baseline check. Always verify whether the bar graph axis starts at zero. Reflex three: angle-to-percentage shortcut. For pie charts with angles, convert mentally using the 90/60/45/36-degree memorised conversions. The CAT preparation blogs library has companion DI blogs and percentage cheatsheets.
Common Doubts About DI Preparation for CAT 2026
Should I prioritise DI over LR in CAT DILR?
For 99 percentile, attempt 2 DI sets and 1 LR set typically. DI sets finish faster and have higher accuracy ceilings. For 95 percentile, 1 DI and 1 LR is often enough. The exact split depends on the paper, but DI-heavy attempts are common in recent CAT papers.
How tricky are recent CAT DI questions?
CAT 2024 had 2 bar graph sets and 1 caselet; CAT 2025 had 1 multiple bar graph, 1 pie chart, and 1 table. Both rewarded the 3-minute reading discipline and percentage shortcuts.
How do I revise DI one week before CAT 2026?
One-week revision: day one, re-read the 3-minute reading framework. Day two, solve 3 bar graph sets timed. Day three, 2 pie chart sets and 2 tables. Day four, 2 caselets. Day five, 3 mixed DI sets under timed mock conditions. Day six, error analysis. Day seven, no practice; rest the section.
Final note. Data interpretation CAT 2026 reduces to one reading framework applied to four chart types. The topic rewards careful reading over fast arithmetic. Drill the 3-minute reading framework, build the three reflexes, and the CAT score predictor alongside mocks will track the lift across DILR.
Related CAT DILR Resources
Solve real CAT DILR sets timed
Hand-picked LR puzzles and DI caselets with timer + solution breakdown.