Year
CAT 2018
Section
Data
Topic
Caselets
Difficulty
Hard
Question
Slot-1
Read the passage and answer the questions below.
Read the passage and answer the questions below.
Passage:
Fuel contamination levels at each of 20 petrol pumps were recorded as either high, medium, or low.
-
Contamination levels at three pumps among were recorded as high.
-
P6 was the only pump among P1-P10 where the contamination level was recorded as low.
-
P7 and P8 were the only two consecutively numbered pumps where the same levels of contamination were recorded.
-
High contamination levels were not recorded at any of the pumps P16-P20.
-
The number of pumps where high contamination levels were recorded was twice the number of pumps where low contamination levels were recorded.
Question 1
Which of the following MUST be true?
The contamination level at P 20 was recorded as medium.
The contamination level at P 13 was recorded as low.
The contamination level at P 12 was recorded as high.
The contamination level at P 10 was recorded as high.
Question 2
What best can be said about the number of pumps at which the contamination levels were recorded as medium?
At least 8
More than 4
Exactly 8
At most 9
Question 3
If the contamination level at P 11 was recorded as low, then which of the following MUST be true?
The contamination level at P 12 was recorded as high.
The contamination level at P 15 was recorded as medium.
The contamination level at P18 was recorded as low.
The contamination level at P 14 was recorded as medium.
Question 4
If contamination level at P 15 was recorded as medium, then which of the following MUST be FALSE?
Contamination levels at P 13 and P 17 were recorded as the same.
Contamination levels at P 11 and P 16 were recorded as the same.
Contamination level at P14 was recorded to be higher than that at P15.
Contamination levels at P10 and P14 were recorded as the same. ## Instructions [51-54] The multi-layered pie-chart below shows the sales of LED television sets for a big retail electronics outlet during 2016 and 2017. The outer layer shows the monthly sales during this period, with each label showing the month followed by sales figure of that month. For some months, the sales figures are not given in the chart. The middle-layer shows quarterwise aggregate sales figures (in some cases, aggregate quarter-wise sales numbers are not given next to the quarter). The innermost layer shows annual sales. It is known that the sales figures during the three months of the second quarter (April, May, June) of 2016 form an arithmetic progression, as do the three monthly sales figures in the fourth quarter (October, November, December) of that year. 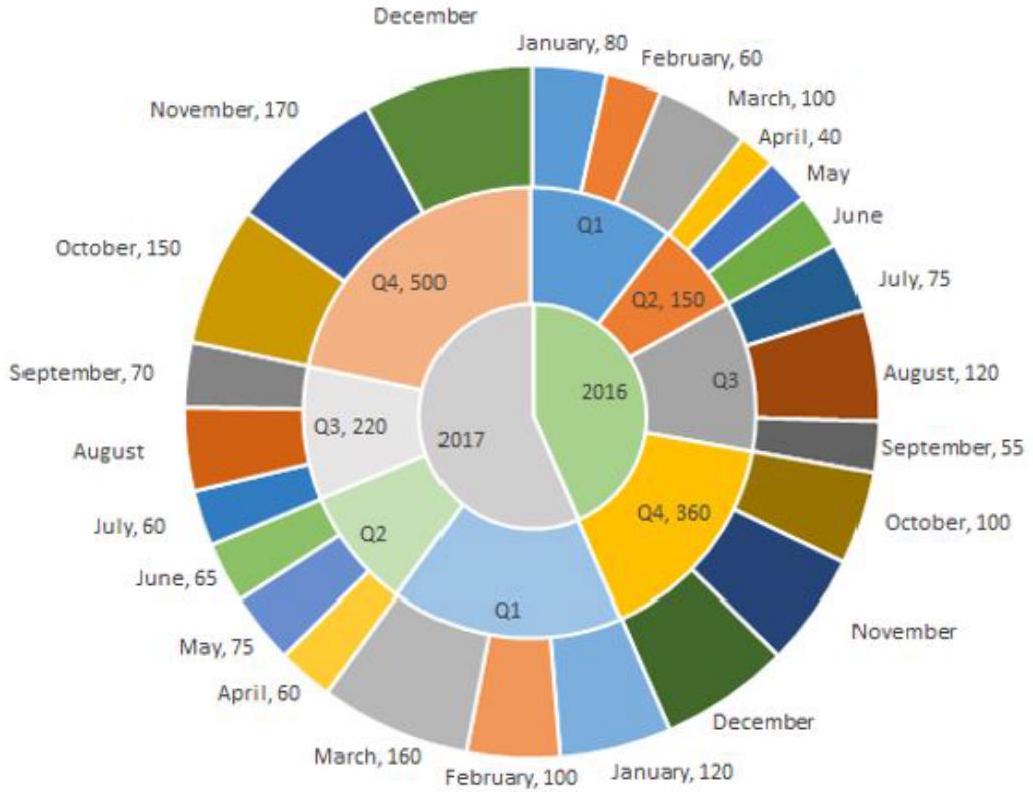
Ace Your MBA Admission Interviews!
Comprehensive interview preparation covering behavioral questions, case studies, and situational scenarios for MBA admissions.
Explore Interview PlatformLoading...