CAT 2026 Percentile vs Rank: Cohort Position Decoded
A clean decoding of CAT 2026 percentile vs rank: the IIM formula in numbers, a percentile-to-rank conversion table for every band from 90 to 99.99, why percentile stays stable across CAT cycles while rank drifts, the sectional mix reality check for IIM shortlists, and five percentile myths busted with cohort arithmetic. Built for aspirants who want to translate mock scores into real cohort position.
CAT 2026 Percentile vs Rank: Cohort Position Decoded
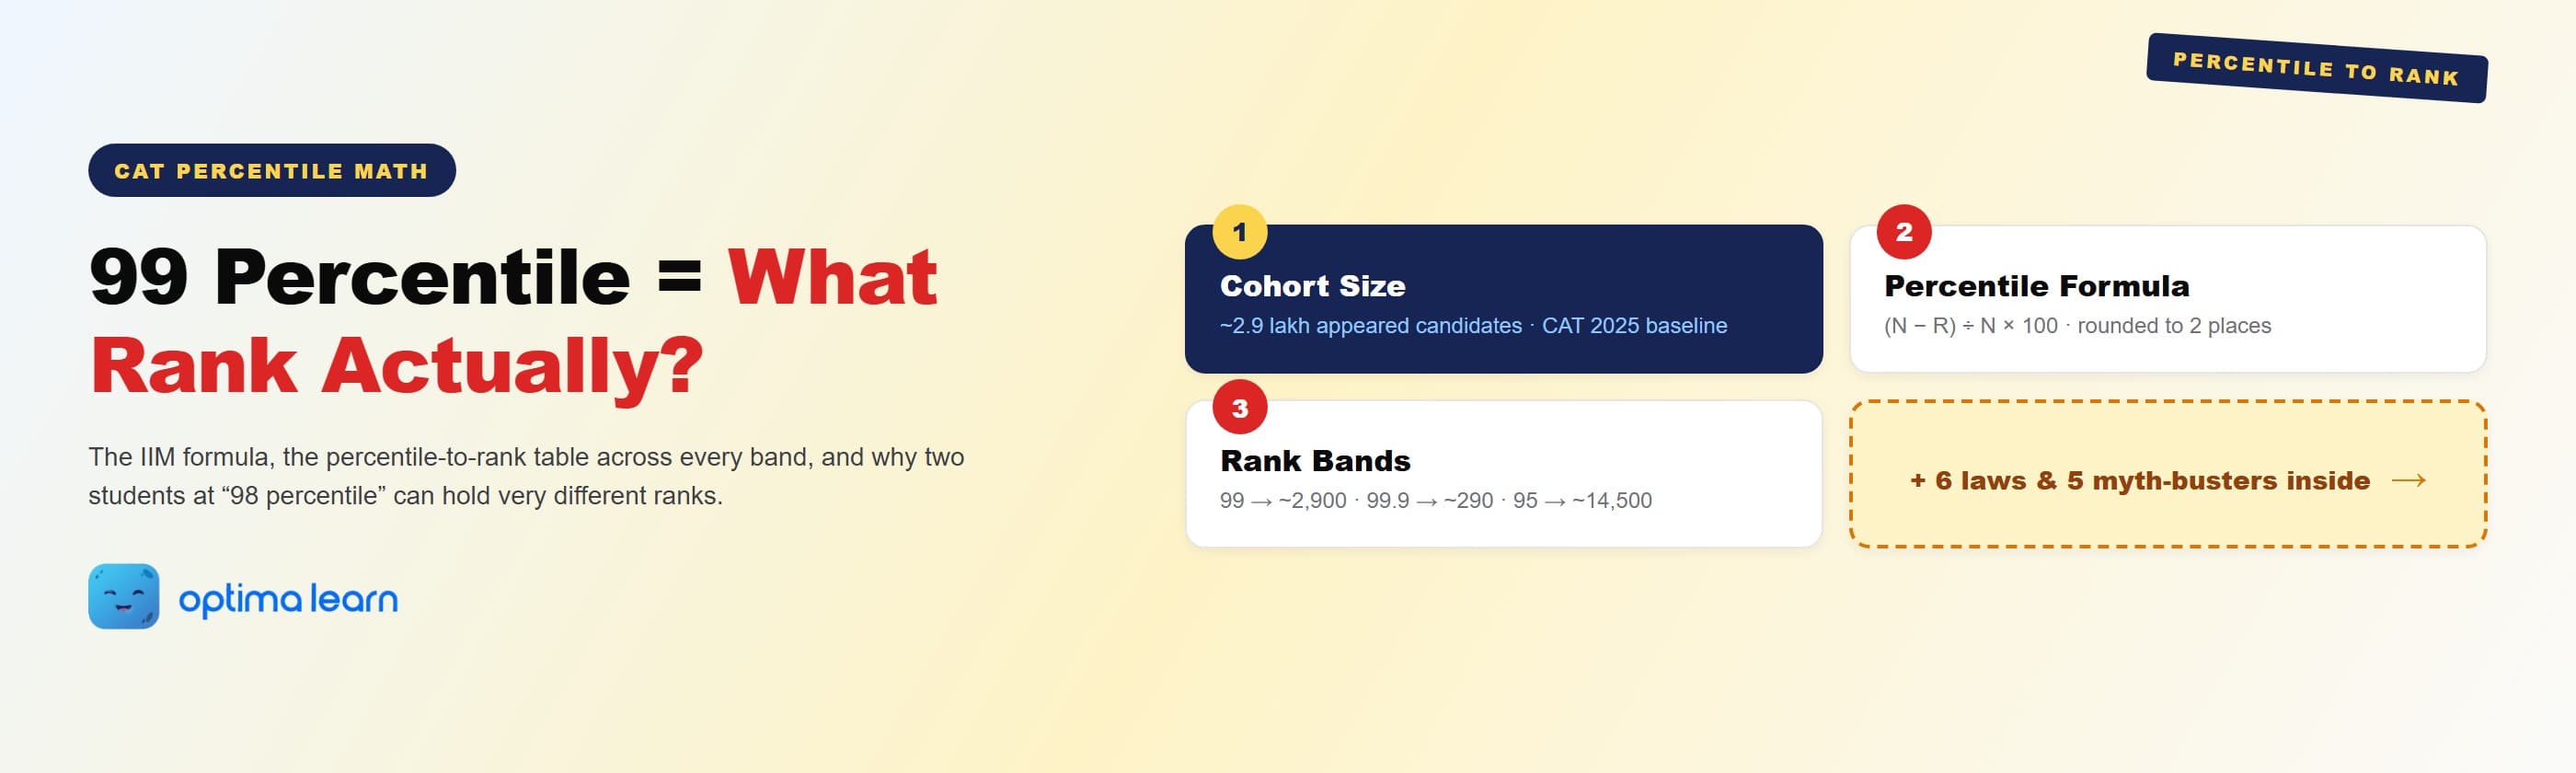
What does 99 percentile actually mean in students? Not in a feel-good way. In real human counts standing above you in the CAT 2026 cohort. The honest answer: roughly 2,900 candidates are ahead of you at 99 percentile, because the appeared cohort hovers near 2.9 lakh. That single number reframes the whole CAT percentile vs rank debate. Percentile is your relative cohort position; rank is the absolute headcount above you. Mix them up and you target the wrong colleges, panic at the wrong scores, and misread your shortlist odds across the IIM and non-IIM tier list. The pages below convert that math into a percentile-to-rank table you can read against any mock score.
CAT rank is your absolute position in the cohort; CAT percentile is your relative position as a percent. At a ~2.9 lakh cohort, 99 percentile equals rank ~2,900, 99.9 percentile equals rank ~290, and 95 percentile equals rank ~14,500. Percentile is more stable than rank across CAT cycles because it normalises for cohort size. IIM shortlists publish in percentile, not rank, so percentile is the single number that decides shortlist eligibility. Rank matters downstream for college targeting and waitlist strategy.
What CAT Percentile vs Rank Actually Means
Rank is the integer position of a candidate in the merit list, counted from the top. Rank 1 is the topper. Rank scales directly with cohort size; a larger cohort produces larger rank numbers at the same skill level. CAT percentile, by contrast, is the percentage of candidates who scored at or below you, rounded to two decimal places. The topper holds 100 percentile; a candidate at 99 percentile beats 99 percent of the cohort.
The two metrics describe the same position from opposite ends. Rank counts down from rank 1; percentile counts up from 0. Translation depends entirely on cohort size. With 2.9 lakh appeared candidates, 1 percent of the cohort is 2,900, so 99 percentile maps to rank ~2,900.
With a 3.3 lakh cohort, the same 99 percentile maps to rank ~3,300. The skill is identical; the rank number is not. IIM shortlists publish in percentile because it stays comparable across cycles. The Optima Learn CAT 2026 result guide walks through how the scorecard displays both numbers and which one carries weight at shortlist stage.
When you read about a CAT cut-off online, check whether the number is a percentile or a rank. IIM cut-offs are percentile-based (99-plus for IIM ABC); private B-schools and waitlist conversations are often rank-based. Treating one as the other is the most common cohort-position mistake at the shortlist stage.
How Percentile Is Calculated: The IIM Formula in Numbers
CAT percentile is computed via a fixed IIM formula applied to normalised scores (not raw marks). The inputs go through two prior steps: slot normalisation and rank ordering. Most aspirants memorise the output and never trace the input chain, which is why percentile feels mysterious when results land.
Plug in the numbers and the math becomes concrete. For a cohort of 2.9 lakh, a candidate at rank 2,900 holds percentile = (2,90,000 minus 2,900) divided by 2,90,000, multiplied by 100 = 99.00. A candidate at rank 290 holds percentile = (2,90,000 minus 290) divided by 2,90,000, multiplied by 100 = 99.90.
The arithmetic is mechanical once cohort size is fixed. The formula runs separately for the overall composite and each of the three sections (VARC, DILR, Quant), generating one overall percentile and three sectional percentiles per candidate.
Scores are normalised across the three exam slots before percentile is calculated, using IIM's slot-difficulty adjustment. Two candidates with identical raw marks in different slots can end up with different percentiles. The Optima Learn CAT 2026 normalization process guide traces this step, while the CAT 2026 marking scheme explains how raw scores convert to the composite.
Percentile to Rank Conversion: Every Band From 90 to 99.99
The table below shows the percentile-to-rank conversion across the bands aspirants actually search for. Numbers are computed against the CAT 2025 baseline of 2.9 lakh appeared candidates. Read the right-most column to get the approximate rank for any percentile target you set for CAT 2026.
| Percentile | Candidates above you (%) | Approx rank (2.9L cohort) | Band |
|---|---|---|---|
| 99.99 | 0.01% | ~29 | Toppers |
| 99.9 | 0.1% | ~290 | IIM ABC core |
| 99.5 | 0.5% | ~1,450 | IIM ABC reach |
| 99.0 | 1.0% | ~2,900 | Old IIM call zone |
| 98.0 | 2.0% | ~5,800 | New IIM call zone |
| 97.0 | 3.0% | ~8,700 | FMS, MDI, SPJIMR |
| 95.0 | 5.0% | ~14,500 | Tier-1 non-IIM |
| 90.0 | 10.0% | ~29,000 | Tier-2 B-schools |
Two reads matter most. First, the rank gap between adjacent percentile bands grows non-linearly at the top. Moving from 99 to 99.5 percentile cuts the rank from ~2,900 to ~1,450, halving the candidates above you. Moving from 99.5 to 99.9 cuts it again by a factor of five, to ~290.
The same one-percentile-point jump means a very different absolute rank improvement depending on the band you start from. Second, the 95 to 99 percentile zone holds the bulk of the action: roughly 11,600 candidates sit between rank 2,900 and rank 14,500, which is the band where most serious CAT aspirants land after their final mocks.
- 99 percentile = top 1% = rank ~2,900 in a 2.9L cohort
- 99.5 percentile = top 0.5% = rank ~1,450
- 99.9 percentile = top 0.1% = rank ~290
- 95 percentile = top 5% = rank ~14,500
- 90 percentile = top 10% = rank ~29,000
Want your mock scores translated into expected CAT 2026 percentile and rank with cohort-adjusted math?
Get My CAT Rank ForecastWhy Percentile Is More Stable Than Rank Across CAT Cycles
Percentile is normalised by cohort size; rank is not. That property explains why IIM shortlists and historical cut-off data are expressed in percentile. When the cohort shifts from 2.7 lakh to 3.1 lakh, a rank-based comparison becomes meaningless. Rank 3,000 in 2024 is a stronger position than rank 3,000 in 2026 if the cohort grew.
Percentile flattens this drift. The same 99 percentile in 2024 and 2026 represents the same top-1-percent cohort position regardless of whether 2.7 lakh or 3.1 lakh candidates appeared. IIM Ahmedabad's 99.5-percentile overall cut-off needs no "for cohort size X" footnote because percentile is cohort-relative by construction.
The same logic applies to sectional percentile floors: an 80-percentile floor in DILR means the same skill level across cycles, even when the section's average difficulty shifts.
Aspirants who compare their mock rank to a senior's CAT 2024 rank to gauge progress are using the wrong metric. Mock cohorts are smaller than the real CAT cohort, so mock ranks are systematically tighter. Use percentile for cross-mock and mock-to-CAT comparison; rank should only be compared within the same mock series and same cohort window.
Rank does carry one advantage: it is a single integer, not a rounded decimal. Two candidates at displayed 99.50 percentile can hold ranks 1,440 and 1,480 if the score band is dense. For tie-breakers and waitlist movement at non-IIM B-schools, rank is the more granular metric. The Optima Learn CAT 2026 cut-off guide covers how IIMs convert percentile cut-offs back to expected ranks.
Using Rank to Target Colleges: The Sectional Mix Reality Check
Rank is most useful when planning the college target list. Overall percentile decides shortlist eligibility; rank reveals how many candidates compete for the same seat band. IIM Ahmedabad, Bangalore, and Calcutta offer roughly 1,400 PGP seats; the top 99.5-percentile band holds ~1,450 candidates. The match is why IIM ABC shortlists run on 99.5-plus overall percentile combined with strong sectional floors.
The newer IIMs (Trichy, Udaipur, Kashipur, Ranchi, Raipur, Rohtak, Shillong, Sambalpur, Sirmaur, Visakhapatnam, Amritsar, Bodh Gaya, Jammu, Nagpur) draw shortlists from the 95 to 98 percentile band, where the candidate pool widens to 8,700 to 14,500.
Sectional floors are the differentiator: an 80-percentile floor in each of VARC, DILR, and Quant filters out skewed scorers even if overall percentile looks healthy. The Optima Learn CAT exam hub tracks the full IIM shortlist pattern by tier.
The Sectional Mix Penalty
Two candidates can share the same overall 99 percentile and end up with very different shortlist outcomes. Candidate A scores 99/99/99 across sections; Candidate B scores 99.8 overall but 75/80/99 sectionally. Candidate A clears most IIM sectional floors; Candidate B fails the VARC floor at IIM Bangalore and Calcutta. Same rank, dramatically different call rate. Rank alone does not capture this; the sectional percentile profile does.
The 5 Myths Aspirants Believe About Percentile and Rank
Forum threads, coaching anecdotes, and senior gyaan have produced a stable list of myths around CAT percentile vs rank. Five of them resurface every year and lead aspirants to misread scores or misplan their B-school target list. Each one collapses the cohort-size lens, so each bust below restores the headcount math behind the percentile number. Run them as a sanity check before locking any score-to-college translation.
"99 percentile means I beat 99 people out of 100."
It means 99 percent of the appeared cohort scored at or below you. In a 2.9 lakh cohort, that is 2,87,100 candidates below and 2,900 above. The "99 out of 100" framing collapses cohort size; the right framing is "top 1 percent of the cohort".
"A higher rank always beats a higher percentile."
Within the same CAT cycle, yes. Across cycles, rank is incomparable; only percentile is. Rank 2,900 in CAT 2025 is the same relative position as rank 3,100 in a 3.1 lakh cohort year. Both equal 99 percentile, even though the integer rank differs.
"IIM ABC needs 99.99 percentile to convert."
The IIM ABC overall shortlist cut-off is usually 99 to 99.5, not 99.99. Final conversion depends on sectional floors, academics, work experience, gender diversity, and WAT-PI scores. 99.99 percentile candidates routinely miss the cut without a balanced application profile across these axes.
"Sectional percentile does not matter if overall is high."
All major IIMs publish sectional floors of 80 to 85. A 99-plus overall candidate with sub-80 sectional percentile in any one section is filtered out of IIM ABC and most new IIM shortlists. Sectional mix is the most underweighted factor in shortlist translation.
"Mock percentiles equal CAT percentiles."
Mock cohorts are smaller (5,000 to 40,000 depending on the series) and self-selected toward serious aspirants. Mock 99 percentile is generally not equal to CAT 99 percentile; raw mock numbers need a calibration shift before they reliably predict CAT cohort position or target list fit.
Together these five myths share one failure mode: they treat the percentile as if it stood alone, detached from cohort size, sectional floors, and profile factors. The fix is mechanical — convert percentile to rank against the cohort baseline, layer sectional thresholds on top, then check profile axes before any shortlist call.
- Rank is absolute (a cohort-size-dependent integer); percentile is relative (a cohort-normalised percent).
- At a 2.9 lakh cohort, 1 percentile point at the top equals roughly 2,900 ranks; the rank-per-percentile gap compresses sharply above 99.
- Percentile is comparable across CAT cycles; rank is not. Use percentile for historical and cross-year benchmarks.
- IIM shortlists publish in percentile; ranks are downstream metrics for college targeting and waitlist movement.
- Sectional percentile floors (VARC, DILR, Quant) filter shortlists independently of overall percentile.
- Mock percentiles need calibration before they translate to CAT percentiles; do not target colleges off raw mock numbers.
Percentile is the metric. Rank is the headcount. Mix them up and you will target the wrong colleges with the right score.
Predict My CAT 2026 Rank
Convert mock scores into expected CAT 2026 percentile and cohort-adjusted rank, with sectional floors mapped to IIM shortlist patterns. Free on the Optima Learn CAT score predictor.
Predict My CAT 2026 RankOptima Learn Editorial Team
CAT preparation specialists publishing structured guides on the CAT exam, IIM admissions, and MBA entrance prep. We model CAT percentile and rank math against the official IIM Indore cohort baselines and shortlist patterns across cycles.
Build your CAT 2026 study plan
Personalised daily plan that adapts to your section-wise mock scores.