CAT 2026 Normalization: How Scaled Scores Are Calculated
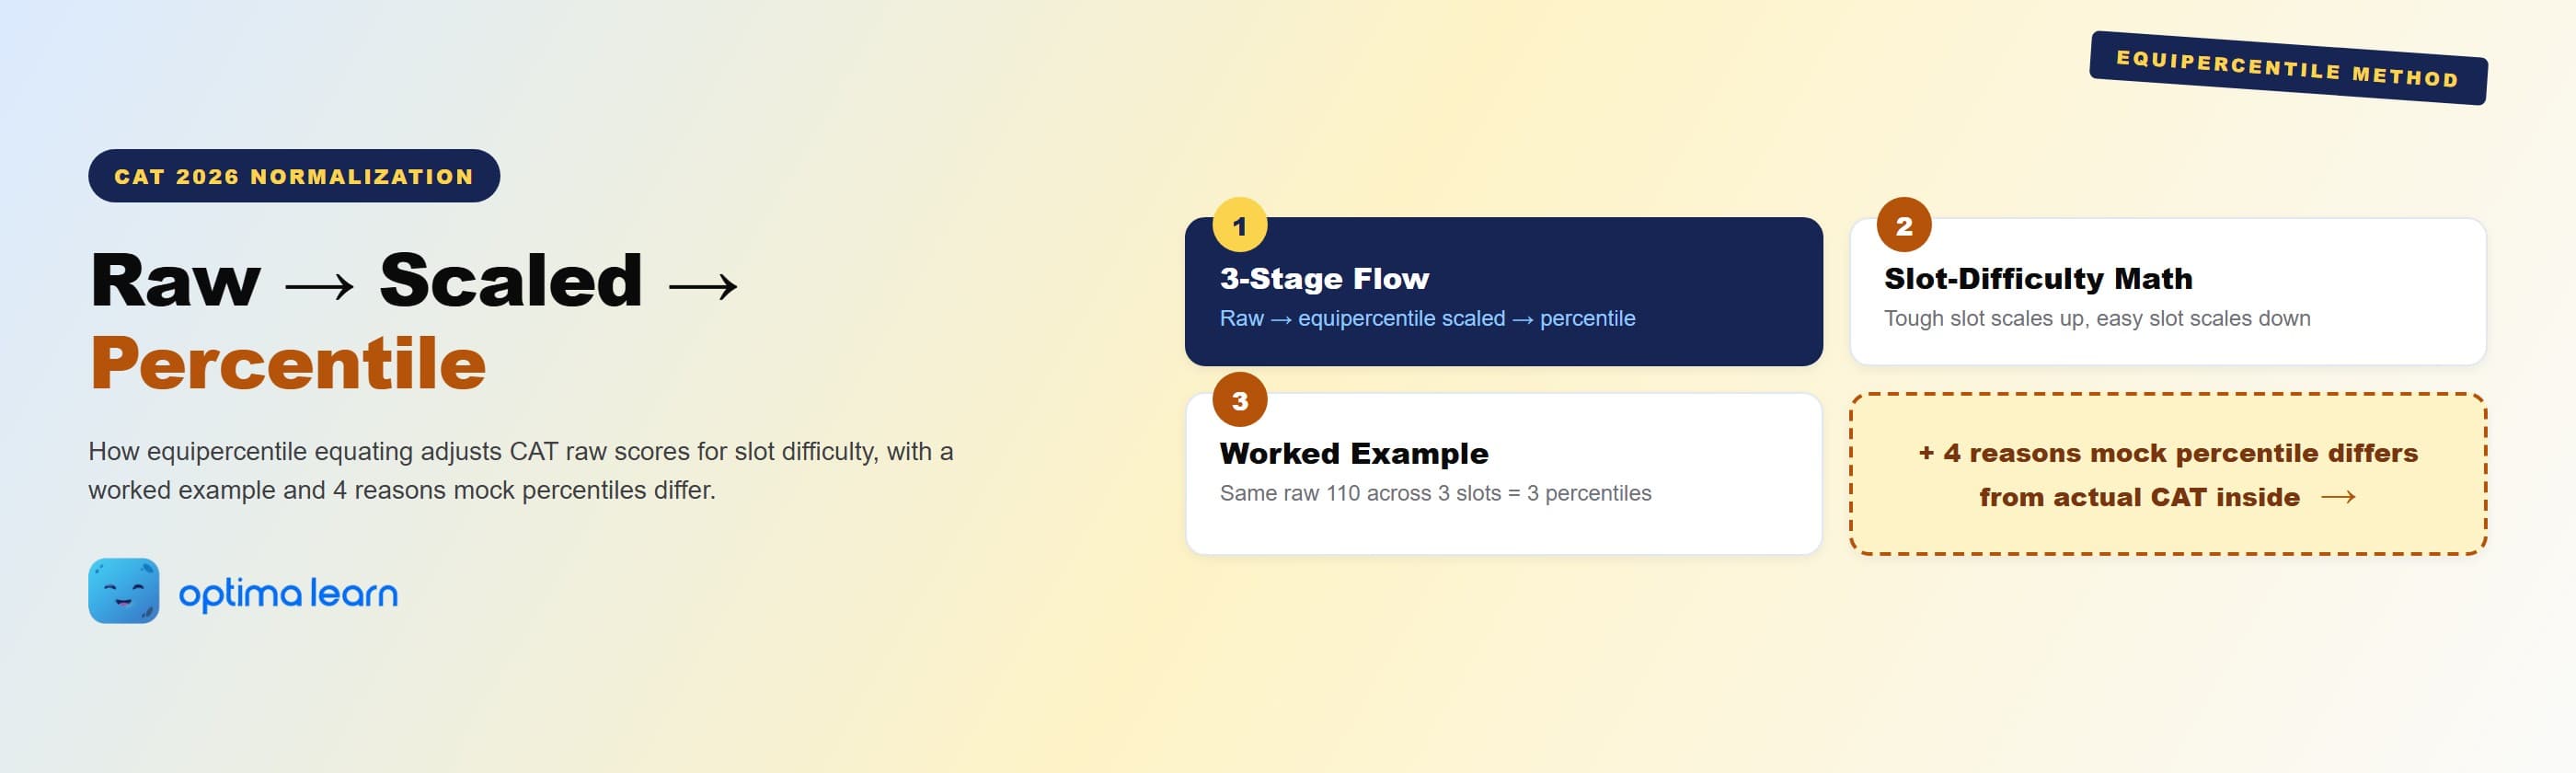
The CAT 2026 normalization process explained as a 3-stage flow: raw scores convert to equipercentile-scaled scores adjusted for slot difficulty, then map to percentile against the full CAT pool. A worked example across three slots shows how the same raw 110 produces three different scaled scores and percentiles, and four reasons explain why mock percentile predictions systematically miscalibrate.

CAT 2026 Normalization: How Scaled Scores Are Calculated
There is a stubborn CAT prep myth: the same raw score in October mocks should translate to the same percentile on the actual CAT in November. It does not. The CAT 2026 normalization process is the reason. Aspirants who internalise the math walk into result day calibrated; aspirants who treat percentile as a flat function of raw score over-celebrate or over-grieve the wrong number for the wrong reason.
This guide breaks down the equipercentile equating method that IIM Indore uses to convert raw scores into scaled scores, the 3-stage flow from raw to percentile, a worked example across three slots, and the four reasons mock-test raw scores systematically miscalibrate to actual CAT percentile.
CAT 2026 uses equipercentile equating to convert raw to scaled scores, adjusting for slot-specific difficulty. Same raw 130 in a tough slot scales higher than 130 in an easy slot. Percentile is then calculated against the full CAT pool, not your slot alone. Mock percentiles miscalibrate by 3 to 10 points because the mock candidate pool differs from the actual CAT pool. Read raw AND scaled on the scorecard, not just percentile.
Why CAT 2026 Needs a Normalization Process
The CAT 2026 paper runs across three slots on November 29: forenoon (8:30 AM), afternoon (12:30 PM), and evening (4:30 PM). Each slot has a different question paper. The papers are calibrated to similar overall difficulty but never identical. Across the past five cycles, the inter-slot difficulty variance has been 4 to 12 marks at the median raw score, meaning a raw of 100 in the toughest slot has historically corresponded to a raw of roughly 108 to 112 in the easiest slot.
Without normalization, a candidate sitting Slot 1 with a 105 raw score would be ranked lower than a candidate sitting Slot 3 with a 110 raw score, even if Slot 1 was tougher and both candidates demonstrated equivalent underlying ability. The IIM admission process penalises the slot-assignment lottery rather than the candidate's skill. Equipercentile equating fixes this by ranking each candidate within their own slot first, then mapping the within-slot rank to a common scaled-score scale that allows cross-slot comparison.
How Equipercentile Equating Actually Works
Equipercentile equating is a statistical technique used in standardised testing across the world: SAT in the US, GMAT, JEE in India, and CAT all use variations of it. The CAT 2026 implementation runs in three sequential stages, applied separately to each section (VARC, DILR, QA) and then to the composite.
Within-slot raw score distribution
For each slot independently, IIM Indore computes the full raw score distribution: the count of candidates at each raw score level, the median, the 25th percentile, the 75th percentile, the 95th percentile, and the 99th percentile within that slot. This creates a slot-specific rank curve.
Example: in Slot 1, the 95th percentile raw might be 108; in Slot 2 (a tougher paper), the 95th percentile raw might be 102; in Slot 3 (an easier paper), the 95th percentile raw might be 114. The within-slot rank is identical (95th) but the raw scores diverge.
Cross-slot scaled score mapping
The 95th percentile in any slot is mapped to a single common scaled score, regardless of which raw produced it. So a Slot 1 raw of 108 (95th in Slot 1), a Slot 2 raw of 102 (95th in Slot 2), and a Slot 3 raw of 114 (95th in Slot 3) all convert to the same scaled score.
The scaled score axis is anchored to historical CAT cycles for stability, so a scaled score of 95 in CAT 2026 carries roughly the same statistical weight as a scaled 95 in CAT 2025 or earlier. This anchoring is why historical percentile-to-scaled mappings are reasonably stable across cycles.
Composite percentile assignment
Each candidate now has a scaled score per section (VARC, DILR, QA), comparable across slots. The composite percentile is computed by aggregating the three sectional scaled scores using the IIM Indore composite formula, then ranking each composite scaled score against the full CAT 2026 candidate pool (all three slots combined). The final percentile is the candidate's rank position in the full pool.
A Worked Example: Same Raw Score, Three Slots
Consider three CAT 2026 candidates: Aarav (Slot 1, tough paper), Bhavya (Slot 2, average paper), Chetan (Slot 3, easier paper). All three score a raw 110 in QA. The normalization process produces three different scaled scores and three different percentiles.
The example uses illustrative numbers, not actual CAT 2026 data (which is published only after the December scorecard). The principle is the same regardless of the exact scaling factor: a tougher slot scales up, an easier slot scales down, and the within-slot rank is what the percentile assignment ultimately tracks.
Raw vs Scaled vs Percentile: The 3 Numbers on Your Scorecard
The CAT 2026 scorecard released in late December shows all three numbers per section: the raw score, the scaled score, and the percentile. Most aspirants only screenshot the percentile and miss the diagnostic information in the raw-to-scaled gap.
| Metric | What it is | What it tells you |
|---|---|---|
| Raw Score | Marks earned using +3/-1/0 | Absolute attempt accuracy. Same calculation across slots and years. |
| Scaled Score | Equipercentile-normalized raw | Adjusted for slot difficulty. Scaled higher than raw = your slot was tougher than average. |
| Percentile | Rank against full CAT pool | Position relative to other candidates in your cycle. The IIM admission gate. |
The raw-to-scaled ratio is the implicit slot-difficulty signal. If your scaled score is 8 to 12 marks higher than your raw, your slot was tougher than the cycle average. If scaled is lower than raw by a similar margin, your slot was easier. IIM Indore does not publish the explicit difficulty factor but the scorecard makes it inferable for any candidate willing to read all three numbers. The Optima Learn CAT score vs percentile 2026 guide maps the raw-to-percentile conversion bands observed across recent cycles.
Calibrate your mock raw scores into a slot-difficulty-adjusted CAT 2026 percentile band.
Predict My CAT 2026 PercentileWhy Your Mock Percentile Differs From Actual CAT Percentile
Mock platforms apply their own normalization to convert raw scores into percentile predictions. The accuracy of these predictions depends on four factors. Aspirants who understand the factors stop over-reacting to single-mock percentile swings.
Mock candidate pool size
Mocks with 30,000+ takers predict actual CAT percentile within 3 to 5 points. Mocks with under 5,000 takers can over-predict by 5 to 10 points because the smaller pool has different distribution.
Mock difficulty calibration
Each mock platform calibrates difficulty differently. A 130 raw on Platform A may equate to 105 raw on the actual CAT due to different question difficulty distribution.
Self-selection bias in mock takers
Serious CAT aspirants take more mocks. So the mock pool skews stronger than the actual CAT pool, deflating mock percentiles below actual CAT percentile for the same scaled score.
No slot normalization in single mocks
Single mocks have one paper, not three. There is no equipercentile equating across slots, so the mock percentile uses simpler ranking math than the actual CAT normalization.
Aspirants who score 99 percentile on a single mock from a small platform sometimes assume they have locked the 99 percentile band for actual CAT. They have not. Mock percentile is a rough band estimate, accurate within 3 to 8 points for the 90 to 99 range. Track the median mock percentile across 8 to 12 mocks from a single major platform; that median is the realistic actual-CAT projection.
"My Slot 2 was tougher than Slot 1, so I will be normalized up."
Maybe. Or maybe everyone in your slot also found it tough, so the within-slot 95th percentile is at the same raw level, and your scaling factor is neutral. Slot tougher than your perception is not the same as slot tougher in distribution.
How to Read the Normalization Signal in Your Mock Analysis
Normalization is not just an abstract IIM statistic. It changes how you should analyse mocks. Three actionable habits from now until November:
- Track the median, not the max. Across 8 to 12 mocks, the median percentile is a far better predictor of actual CAT performance than the single best mock. Median absorbs slot-difficulty variation; max amplifies a lucky paper.
- Compare scaled scores across platforms, not raw scores. A raw 120 on Platform A vs a raw 105 on Platform B is meaningless. The percentile assigned by each platform is a closer (though still imperfect) comparison.
- Discount single-mock outliers above or below the median by 4+ points. A 99 percentile mock when your median is 94 is not a calibration; it is a slot-easier-than-CAT effect. Likewise, a 87 percentile mock when your median is 94 is usually a single-paper variance, not a regression.
Build a single Google Sheet with three columns: mock date, raw score, percentile. After 10 mocks, plot the trend. The slope tells you whether you are improving; the median tells you your CAT 2026 percentile band. The Optima Learn CAT mock test analysis framework covers the per-mock debrief structure that feeds into this tracking sheet.
Normalization on Result Day: What to Look For
On result day (around December 21, 2026), open the scorecard and check three things in this order: the raw score (confirms your self-score from December 6), the scaled score (tells you the slot-difficulty signal), and the percentile (the IIM-admission number). Aspirants who only check the percentile miss the diagnostic in the raw-to-scaled gap.
The Optima Learn CAT result 2026 guide walks through the full scorecard anatomy, and the CAT 2026 marking scheme guide covers the raw-score calculation that feeds into the normalization. Aspirants planning the December debrief should also check the CAT exam overview page for cycle-specific updates.
- Three slots = three different papers = three different difficulty levels. Always.
- Equipercentile equating ranks within slot first, then maps to a common scaled scale.
- Percentile is your rank against the full CAT pool, not just your slot.
- Read raw, scaled, AND percentile on result day; the raw-to-scaled gap is your slot signal.
- Mock percentile predicts actual within 3 to 8 points; track median, discount outliers.
- Same raw score does NOT mean same percentile; that comparison is meaningless across slots or cycles.
Percentile is a position. Raw is a count. Scaled is the bridge. Read all three to know what your CAT 2026 result actually says.
Calibrate Your CAT 2026 Mock Percentile to Actual CAT
The Optima Learn CAT score predictor applies slot-difficulty patterns from the past five CAT cycles to convert your mock raw scores into actual-CAT-calibrated percentile bands.
Predict My CAT 2026 Percentile BandOptima Learn Editorial Team
CAT preparation specialists publishing structured guides on the CAT exam, IIM admissions, and MBA entrance prep. We track CAT normalization methodology, slot-difficulty patterns, and mock-to-actual percentile calibration across cycles.
Make this routine stick
Daily tasks, focus blocks, and weekly debriefs, wired into one planner.